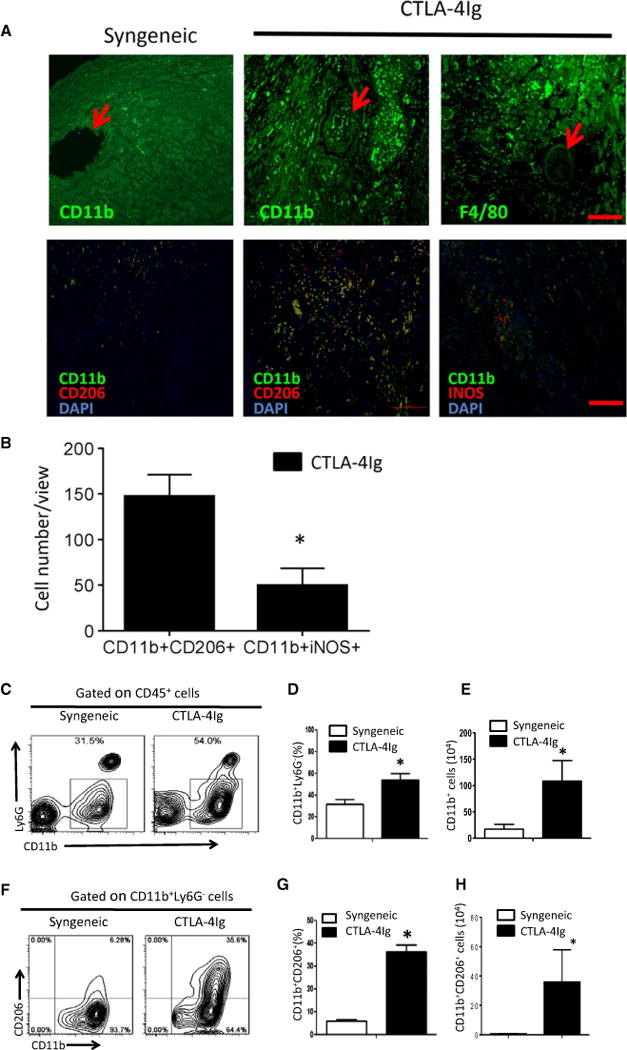
Figure 2. Assessment of graft-infiltrating macrophages in heart allograft at 30 days after transplantation.

(A) Immunofluorescence staining of graft-infiltrating macrophages in CTLA4-Ig–treated mice was shown. Syngeneic heart grafts were used as controls. The arrows indicate arteries in the grafts (upper panel). Expression of CD206 or iNOS (red) by infiltrating macrophages was determined by double staining for DAPI (blue), CD11b (green) and CD206 (red) or iNOS (red). The merged fluorescence (yellow) identifies cells staining for both CD11b and CD206 or CD11b and CD206. Scale bar = 100 μm. (B) Cell counts from immunofluorescence staining in (A) showing CD11b+CD206+ (M2) and CD11b+iNOS+ (M1) cells per microscopic view. Data shown are mean cell number ± SE of five random views per sample for a total of three samples. (C) FACS plot showing gating strategy of graft infiltrating cells among CD45+ cells obtained from syngeneic and CTLA4-Ig–treated allografts. (D) Relative percentage of CD11b+ macrophages retrieved from each heart graft. Data shown are mean ± SE of four transplants in each group. (E) The absolute number of CD11b+ cells from each heart transplant. Data shown are mean ± SE of four transplants in each group. (F) FACS plot showing gating strategy for CD206+ cells among the total CD11b+ population. (G) Relative percentage of CD206+ cells among the total CD11b+ cells from syngeneic and CTLA4-Ig–treated allografts. Data shown are mean ± SE of four transplants in each group. (H) The absolute number of CD11b+CD206+ cells in each graft. Data shown are mean ± SE of four transplants in each group (*p < 0.05). CTLA4-Ig, CTLA4 immunoglobulin; DAPI, 4′,6-diamidino-2-phenylindole; FACS, fluorescence-activated cell sorting; iNOS, inducible nitric oxide synthase; SE, standard error.
