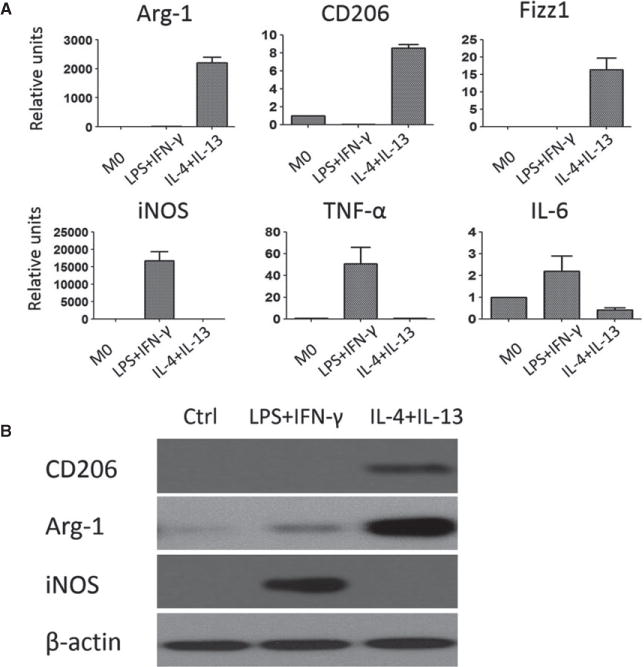
Figure 3. Polarization of bone marrow–derived macrophages into M1 and M2 cells in vitro.

(A) Mouse bone marrow–derived macrophages were polarized into M1 cells with LPS and IFN-γ or to M2 cells with IL-4 and IL-13. Expression of M1- and M2-associated molecules were assessed by quantitative reverse transcriptase polymerase chain reaction 24 h later. Bone marrow–derived macrophages without polarizing cytokines were included as controls and referred to as M0 cells. The relative levels for Arg-1, CD206, Fizz1, iNOS, TNF-α, and IL-6 gene transcripts were normalized against HPRT and shown as mean ± SE of four independent experiments. (B) Western blot showing expression of CD206, Arg-1 and iNOS proteins in polarized M1 and M2 cells. The blot shown is representative of four independent experiments. Arg-1, arginase 1; IFN-γ, interferon γ; iNOS, inducible nitric oxide synthase; LPS, lipopolysaccharide; SE, standard error; TNF-α, tumor necrosis factor α.
