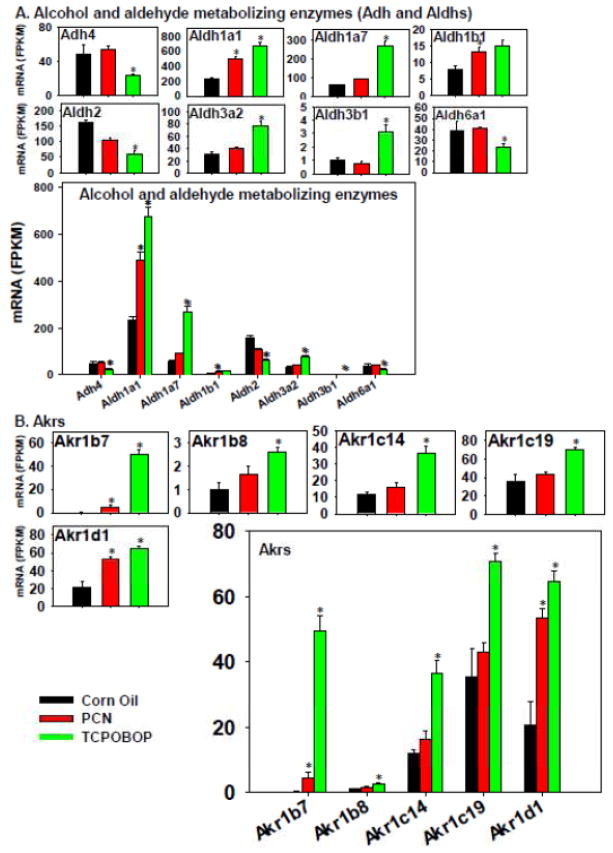
Figure 6.
Regulation of other Phase-I drug-metabolizing enzymes by PCN and TCPOBOP in livers of wild-type mice: (A) alcohol and aldehyde metabolizing enzymes; (B) dehydrogenases and reductases. Only the differentially expressed genes in either PCN- or TCPOBOP-treated groups are presented. Genes in the same family are graphed together to quantitatively compare the mRNA abundance, and are graphed individually to better visualize the mRNA fold-changes by PCN or TCPOBOP of all genes. Asterisks represent statistically significant differences as compared to corn oil-treated group (FDR-adjusted p value <0.05).

