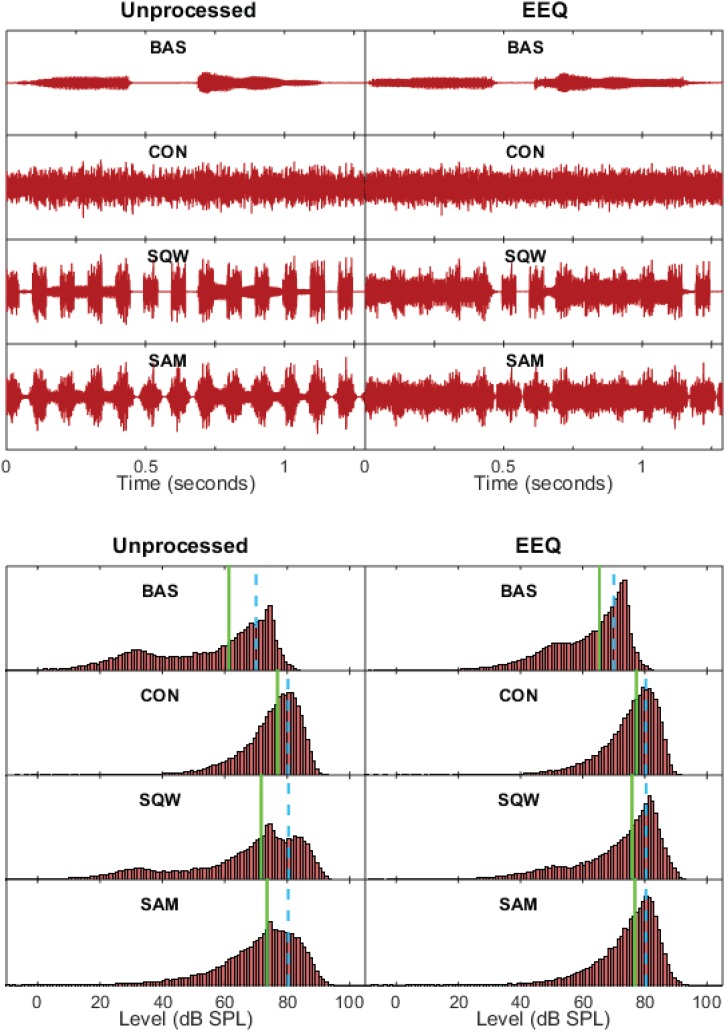
FIG. 2.
(Color online) Stimulus waveforms (upper half of plot) and level distributions (lower half) for unprocessed (UNP) signals, shown on left, and EEQ signals, shown on right, depicting the utterance /ɑ/-/p/-/ɑ/ (produced by a male talker) at a level of 70 dB SPL in four different noise backgrounds. In each half of the plot, the rows represent speech in (a) the baseline (BAS) condition with a continuous-noise background of 30 dB SPL, i.e., speech-to-noise ratio (SNR) of +40 dB, (b) continuous (CON) noise with SNR of −10 dB, (c) square-wave interrupted (SQW) noise with SNR of −10 dB, and (d) sinusoidally amplitude-modulated (SAM) noise with SNR of −10 dB. The level distribution histograms were derived from sampling the waveform at a rate of 32 kHz, converting the samples to dB, and generating a histogram of unit bin size with normalized probabilities. The dashed vertical bar indicates the rms level of each of the signals; the solid vertical bar indicates the median of the level distribution.

