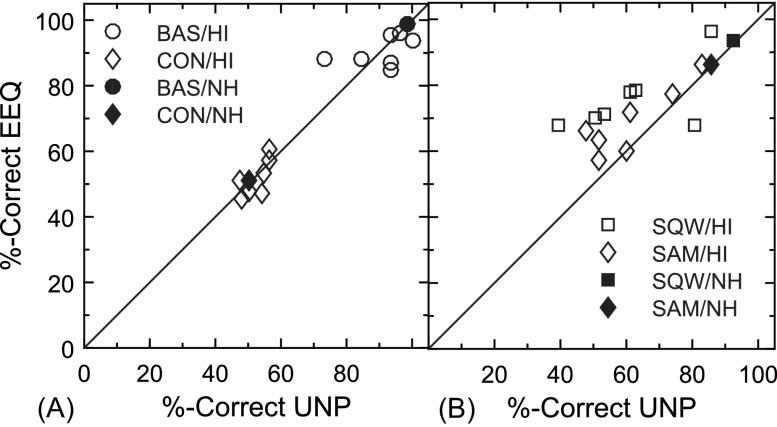
FIG. 3.
Consonant identification scores in %-Correct: EEQ scores plotted as a function of UNP scores for each HI listener (unfilled symbols) and for the mean across four NH listeners (filled symbols). Scores for the two continuous noise backgrounds (BAS and CON) are shown in the panel on the left and scores for the two fluctuating noise backgrounds (SQW and SAM) are on the right. The diagonal line in each panel indicates equivalent performance for the two types of processing. (Abbreviations as defined in Fig. 2.)

