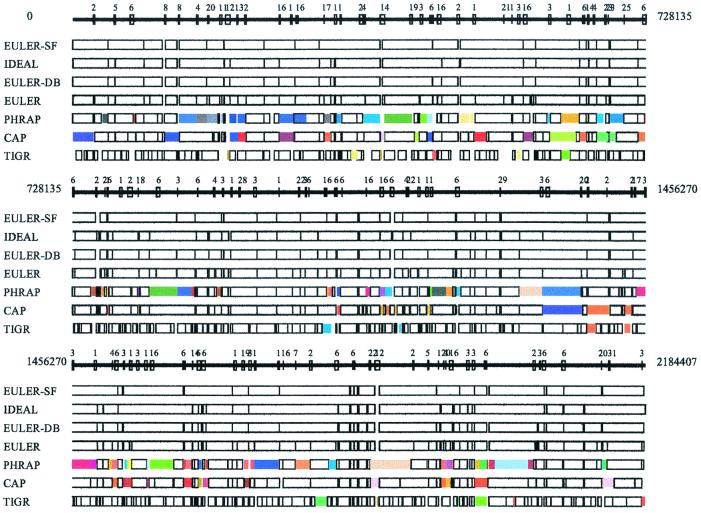
Figure 1.
Comparative analysis of euler, phrap, cap, and tigr assemblers (NM sequencing project). Every box corresponds to a contig in NM assembly produced by these programs with colored boxes corresponding to assembly errors. Boxes in the ideal assembly correspond to islands in the read coverage. Boxes of the same color show misassembled contigs; for example, two identically colored boxes in different places show the positions of contigs that were incorrectly assembled into a single contig. In some cases, a single colored box shows a contig that was assembled incorrectly (i.e., there was a rearrangement within this contig). Repeats with similarity higher than 95% are indicated by numbered boxes at the solid line showing the genome. To check the accuracy of the assembled contigs, we fit each assembled contig into the genomic sequence. Inability to fit a contig into the genomic sequence indicates that the contig is misassembled. For example, phrap misassembles 17 contigs in the NM sequencing project, each contig containing from two to four fragments from different parts of the genome.

