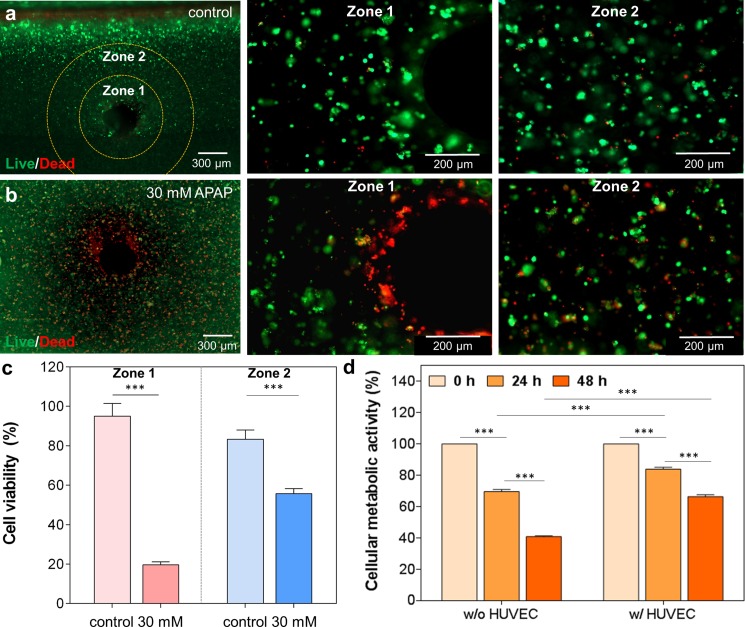
FIG. 5.
Live/dead staining images of cross sectional views of the 3D vascularized liver tissue construct (a) without and (b) with 30 mM APAP treatment under dynamic conditions. Zone 1 was defined as the perfusion territory in close proximity to the channel (∼300 μm) and Zone 2 was defined as the perfusion zone furthest away (∼600 μm) from the channel. (c) Quantification of cell viability after 48 h perfusion of cell culture media (control) and 30 mM APAP treatment. Media only perfusion (control) showed good cell viability in both zones, while 30 mM APAP perfusion exhibited a higher cell death accentuated in Zone 1 compared to Zone 2. (d) Cellular metabolic activity in the 3D liver tissue constructs with and without HUVEC layer after 24 and 48 h 30 mM APAP treatment. HepG2/C3A only constructs showed a lower metabolic activity compared to the HUVEC-HepG2/C3A constructs suggesting a protective action of the HUVECs during drug treatment compared to the other construct.

