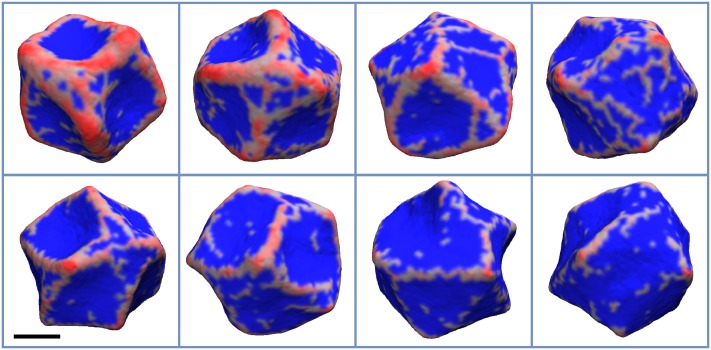
FIG. 5.
The final configuration of the vesicle for and C0 values of 0.07, 0.09, 0.12, 0.15, 0.17, 0.20, 0.30, and 0.40 nm−1, which appear from left to right and top to bottom, respectively. The areas of the membrane with non-zero protein local density are colored red, while the rest is colored blue. The scale bar marks 100 nm.

