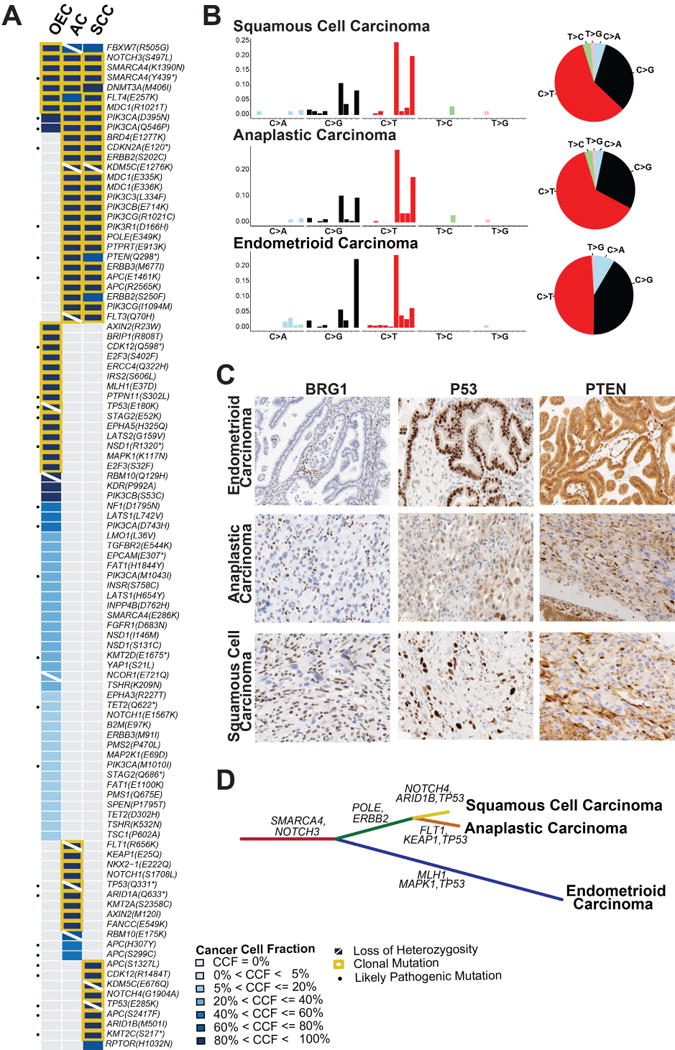
Figure 2. Repertoire of non-synonymous somatic mutations, mutational signatures and clonal decomposition of the ovarian endometrioid carcinoma with mucinous differentiation, anaplastic carcinoma and squamous cell carcinoma components.

(A) Heatmap depicting the cancer cell fractions of the somatic SNVs identified in each component. Each column represents one sample; mutations are reported in rows. The cancer cell fraction and clonality of the mutations were defined using ABSOLUTE.21 Note that no somatic mutations were detected in the sarcoma-like component. (B) The barplots illustrating the mutational signatures of all somatic SNVs of a given histologic component according to the 96 substitution classification defined by the substitution classes (i.e. C>A, C>G, C>T, T>A, T>C and T>G bins), and the 5′ and 3′ sequence context. The height of colored bars represents the normalized fraction of mutations attributed to each of the 96 sub-bins. The pie charts show the mutational signatures present in a given component, the sizes of the pie slices are proportional to the normalized fraction of the mutation types (i.e. C>A, C>G, C>T, T>A, T>C and T>G).9 (C) Representative micrographs of BRG1, p53 and PTEN expression in the endometrioid carcinoma, anaplastic carcinoma component and squamous cell carcinoma component (10× magnification). Loss of BRG1 protein expression is seen in the three components (lymphocytes and stromal cells serve as internal positive control); the p53 protein expression pattern differs between tumor components, consistent with their distinct private TP53 mutations; PTEN expression is retained in the endometrioid carcinoma areas, while the anaplastic carcinoma and squamous cell carcinoma components display marked reduction of PTEN expression. (D) Phylogenetic tree depicting the clonal evolution of the different histologic components. The length of the branches is proportional to the number of mutations that distinguish a given clone from its ancestral clone, and selected somatic mutations that define a given clone are shown. AC, anaplastic carcinoma component; CCF, cancer cell fraction; OEC, ovarian endometrioid carcinoma; SCC, squamous cell carcinoma component.
