
Figure 3. Histological examination of brain sections from injected mice.
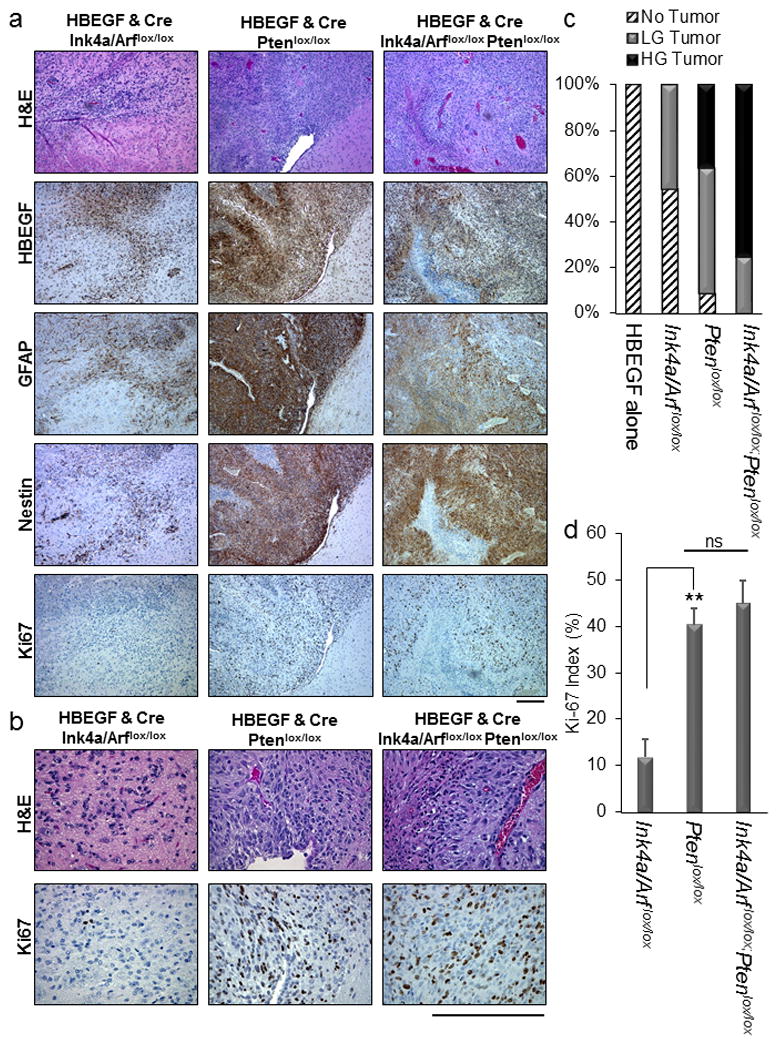
(a) Representative H&E and HBEGF, GFAP, Nestin, and Ki67 immunohistochemistry images of HBEGF-driven tumors from each strain of mice injected with viruses containing HBEGF and Cre. Scale bar represents 300 μm. The age of the mouse shown for HBEGF Ink4a/Arf lox/lox was 39d, for HBEGF Ptenlox/lox was 31d, and for HBEGF Ink4a/Arf lox/lox Ptenlox/lox was 31d. (b) Representative high power H&E and Ki67 images of HBEGF-driven tumors from each strain of mice injected with viruses containing HBEGF and Cre. Scale bar represents 300μm. (c) Percentage of each tumor grade observed in Nestin-TVA;Ink4a/Arf lox/lox, Nestin-TVA;Ptenlox/lox, and Nestin-TVA;Ink4a/Arf lox/lox;Ptenlox/lox mice injected with viruses containing HBEGF alone or in combination with Cre. Low grade (LG) tumors were characterized by nuclear atypia and pleomorphism while high grade tumors (HG) were characterized by the presence of necrosis, vascular proliferation, and mitotic figures. (d) Quantification of Ki-67 proliferation index for HBEGF-driven tumors. For each tumor, the average of four high-power fields is shown. Data are represented as mean percentage ± S.E.M. Statistical significance is shown by the following key: ** P < 0.005 with not significant (ns) denoting P > 0.05.