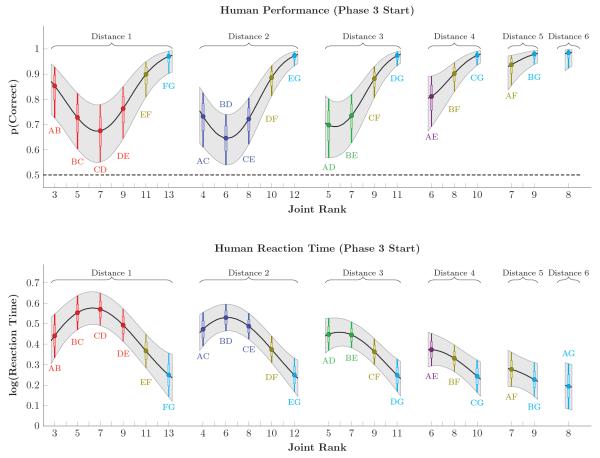
Figure 10. Estimates of response accuracy (top row) and log reaction times (bottom row) in humans during the first trial of phase 3.
Pairs are sorted by symbolic distance and by joint rank. Gray shaded areas correspond to the 99% credible interval, interpolated between items. Individual pairs are color-coded identically to Figures 2-5, and also include a horizontal bar to denote 80% credible intervals. Human response accuracy showed a pronounced terminal item effect, but a weak symbolic distance effect. Human reaction times, on the other hand, displayed both effects.

