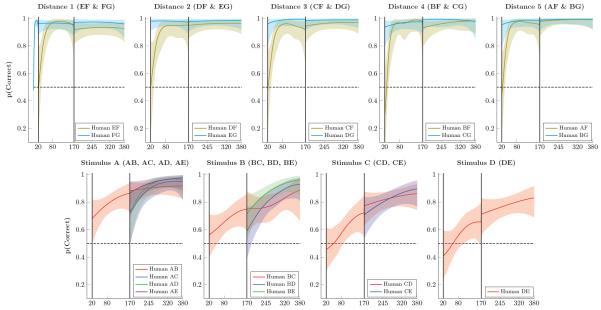
Figure 4. Proportion of correct responses by humans for stimulus pairs over successive trials.
Shaded areas represent 99% credible intervals. Top Row. Performance on stimulus pairs that included F and/or G for distances 1 through 5. Performance on FG rapidly rose to ceiling levels, as did performance on pairs including G. Other pairs including F began at chance level at the start of Phase 2, but also rapidly rose to ceiling. Bottom Row. Performance on pairs composed of items A through E. Accuracy on adjacent pairs rose steadily on Phases 2 and 3, and novel non-adjacent pairs were above chance (but below adjacent pairs) at the start of Phase 3.

