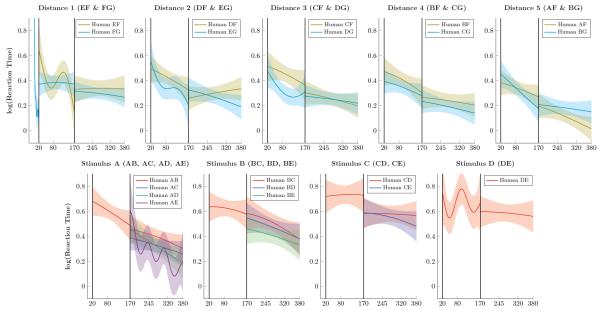
Figure 5. Human reaction times (log-transformed) over successive trials.
Shaded areas represent 99% credible interval. Top Row. Log reaction times for pairs that included F and G for distance 1 through 5. Participants were much slower than monkeys, but reaction times steadily improved over the course of the experiment. Bottom Row. Log reaction times for pairs composed of items A through E. Reaction times to pairs that included item A sped up most during learning, whereas pairs closer to the “middle” of the list (such as DE) sped up very little.

