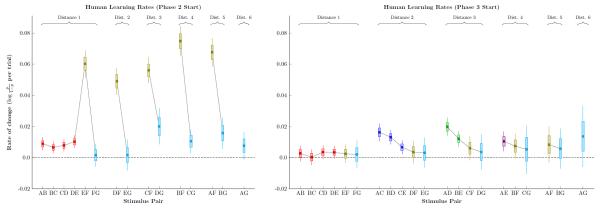
Figure 8. Estimates of the rate of change of response accuracy for humans, measured in log-odds units of probability per trial.
Pairs are sorted by symbolic distance and by joint rank. Boxes represent 80% credible intervals, while whiskers represent 99% credible intervals. Individual pairs are color-coded identically to Figures 2-5. Left. Learning rate at the start of phase 2. Pairs including stimulus F tended to show much faster improvement. Right. Learning rate at the start of phase 3. Novels pairs showed elevated learning, and most learning rates were higher than those observed in monkeys.

