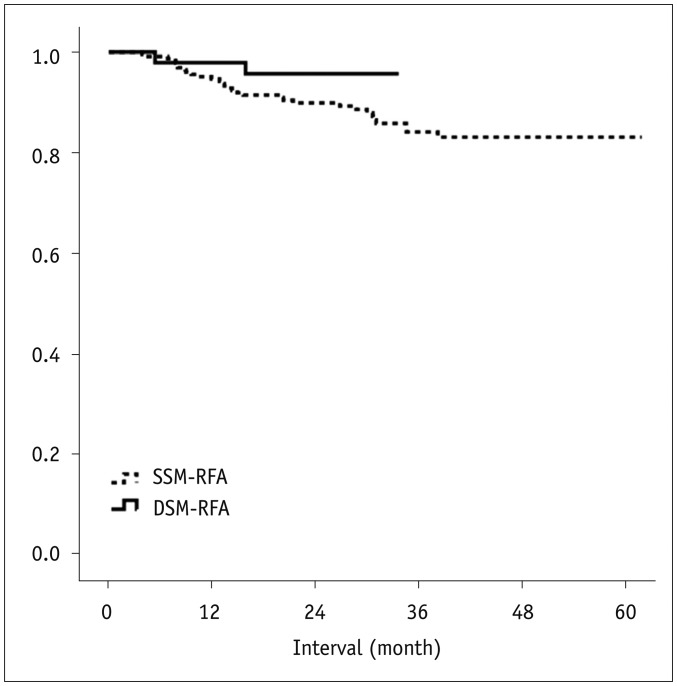
Fig. 2. Life-table survival curve of local tumor progression-free survival in patients treated with DSM and SSM-RFA.
One- and two-year local tumor progression-free survival rates of DSM-RFA group vs. SSM-RFA group were 97.9% vs. 94.6% and 95.7% vs. 89.9%, respectively. p value was 0.149, which was calculated using log-rank test.

