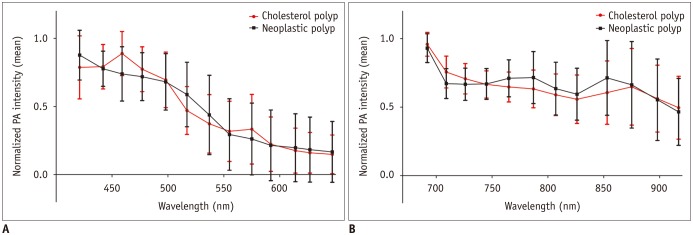
Fig. 1. Normalized PA intensities of cholesterol and neoplastic polyps.
Mean normalized PA intensities of cholesterol and neoplastic polyps (A) at shorter wavelengths between 421 and 647 nm, and (B) at longer wavelengths between 692 and 917 nm. Error bars denote standard deviation. Cholesterol polyps had significantly higher PA intensities at 459 nm compared to neoplastic polyps. PA = photoacoustic

