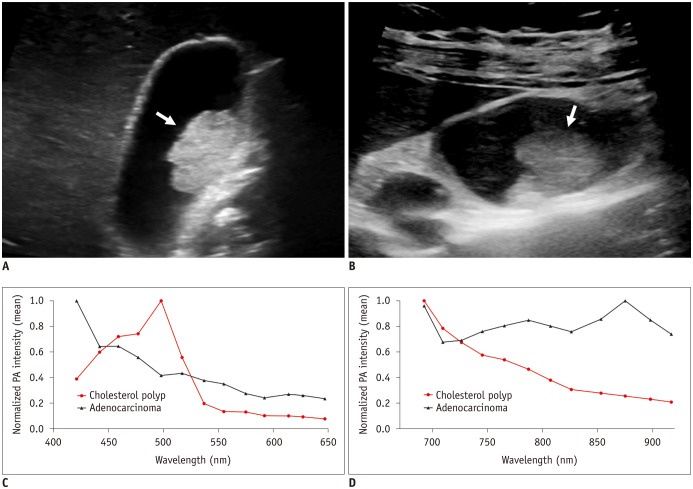
Fig. 4. Gray-scale ultrasound images and normalized PA intensities of cholesterol polyp and adenocarcinoma.
A. GB cholesterol polyp (arrow) in 53-year-old woman. Gray-scale US exhibits hyperechoic polypoid mass (2.1 cm) in GB body. B. GB adenocarcinoma (arrow) in 45-year-old woman. Gray-scale US shows iso- to hyperechoic mass (2.3 cm) in GB body. C, D. Mean normalized PA intensities of two polyps (C) at shorter wavelengths between 421 and 647 nm, and (D) at longer wavelengths between 692 and 917 nm. Two polyps show distinct PA spectral patterns: PA intensity of cholesterol polyp continuously decreases at 692–917 nm, whereas adenocarcinoma exhibits absorption peak at 875 nm. GB = gallbladder, US = ultrasonography

