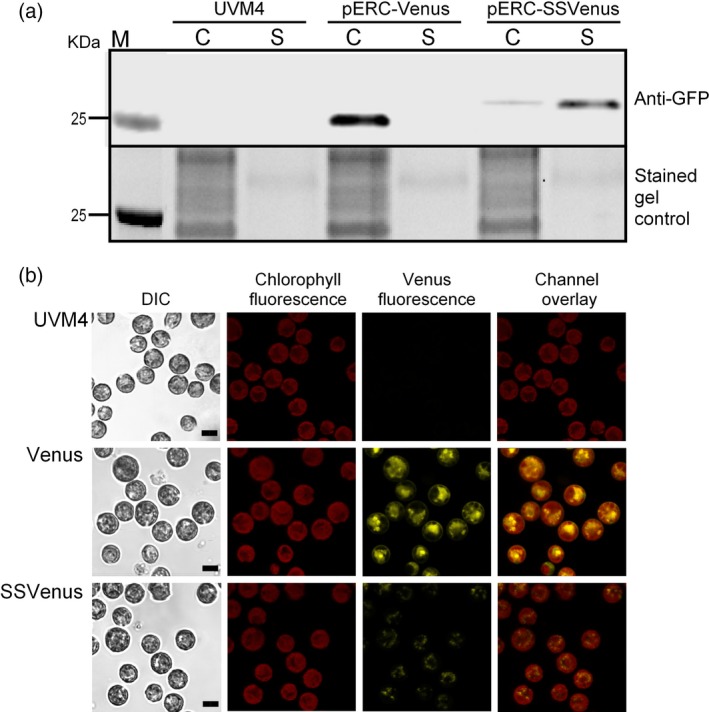
Figure 2.

Subcellular localization and expression of fluorescent proteins from the Venus and SSVenus transgenic lines. (a) Western blot analysis of total proteins from cell lysates and supernatants (top panel). Total proteins were loaded in equal amounts and separated by SDS‐PAGE and visualized upon the UV irradiation (lower panel, indicated as ‘stained gel control’). Transgenic lines were grown until ~2 × 10⁶ cells/mL in TAP media. Harvested cells (C) and supernatants (S) were resuspended in 4× Laemmli buffer. The untransformed UVM4 strain was used as a control. (b) Expression of Venus in C. reinhardtii cells visualized by confocal microscopy. Parental strain UVM4 was used as a control. Cells transformed with pERC‐Venus (Venus line) and pERC‐SSVenus (SSVenus line) were analysed. All images were acquired using the same settings for all strains. Scale bar indicates 5 μm.
