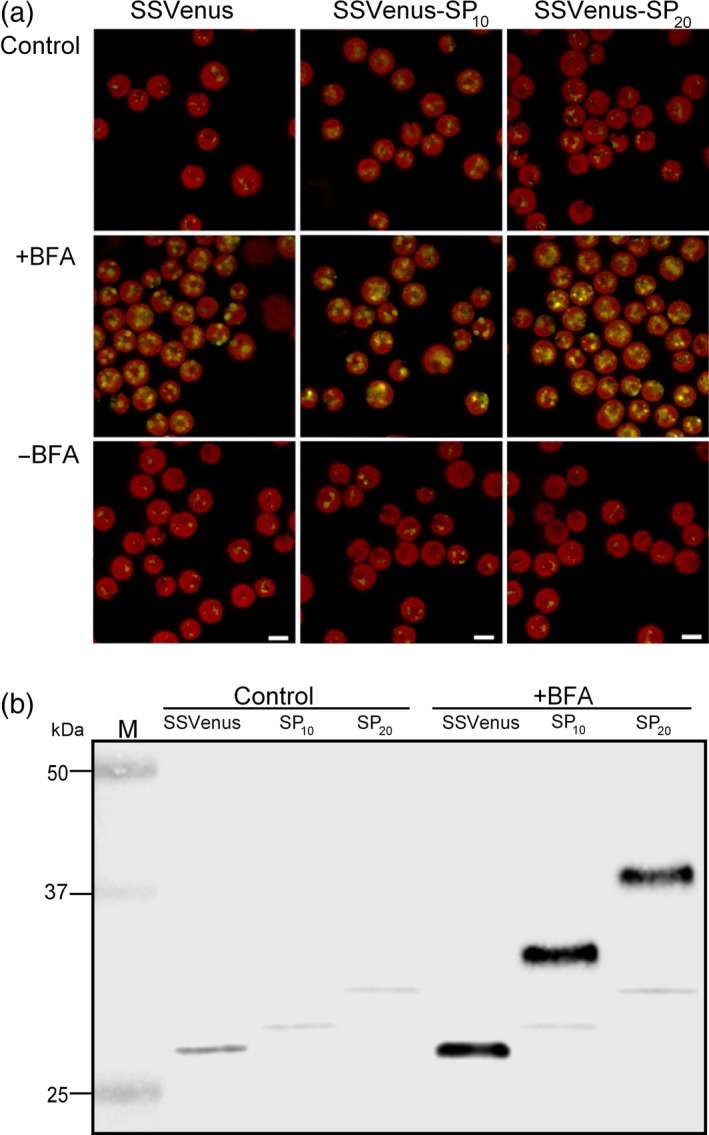
Figure 6.

Effect of the BFA treatment on the subcellular localization and molecular masses of the Venus and fusion Venus. Transgenic cells in the exponential growth phase were treated with BFA at 50 μm or solvent control (DMSO) for 4 h. (a) Alteration of the fluorescence patterns in cells secreting Venus and fusion Venus upon treatment with BFA visualized by confocal microscopy. Images show that BFA treatment increases the fluorescence intensity in the transgenic cells as a result of the accumulation in the ER. All images were acquired using the same settings for all strains and treatments. Scale bars indicate 5 μm. (b) Western blot analysis of cell lysates from cells treated with BFA. Lanes 1 and 4, SSVenus; lanes 2 and 5, SSVenus‐(SP)10; lanes 3 and 6, SSVenus‐(SP)20. One hundred and fifty micrograms of TSP were loaded into each well.
