Figure 6.
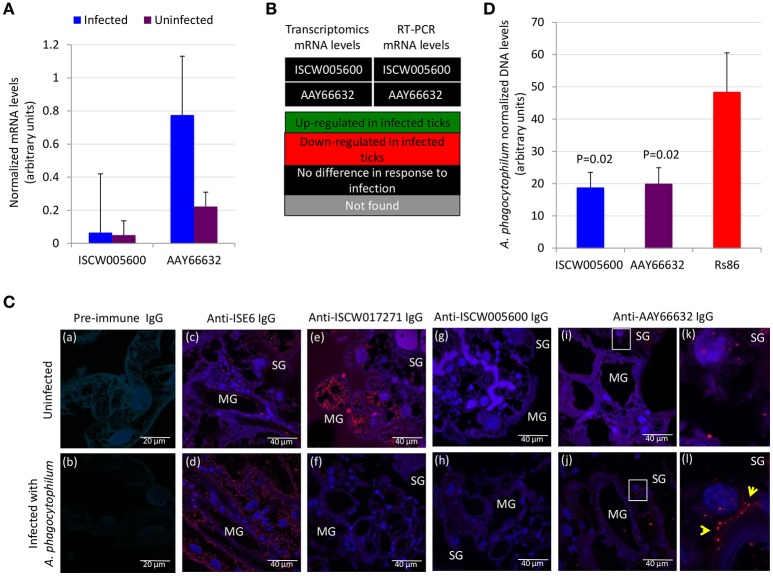
Functional characterization of selected candidate tick protective antigens. (A) Results of the RT-PCR analysis of the expression of ISCW005600 and AAY66632 genes in uninfected and A. phagocytophilum-infected ISE6 tick cells. Results were presented as average + S.D. normalized Ct-values and compared between infected and uninfected cells by Student's t-test with unequal variance (P ≤ 0.05; N = 4). (B) Comparison of the transcriptomics and RT-PCR results for mRNA levels of ISCW005600 and AAY66632 genes in ISE6 tick cells in response to A. phagocytophilum infection. Transcriptomics results were obtained from Villar et al. (2015a). (C) Representative images of imunofluorescence analysis of uninfected (a,c,e,g,i,k) and A. phagocytophilum-infected (b,d,f,h,j,l) adult female I. scapularis midguts (MG) and salivary glands (SG). Tick tissues were stained with rabbit pre-immune control IgG (a,b), anti-ISE6 tick cells IgG (c,d), or anti-tick antigens IgG (e–l) labeled with RFP (red) and DAPI (blue). Yellow arrows illustrate a positive staining for AAY66632 in the SG sections in white squares in infected (l) but not uninfected (k) ticks. (D) The A. phagocytophilum DNA levels were determined after RNAi in infected ISE6 tick cells treated with ISCW005600 and AAY66632 dsRNAs or control Rs86 dsRNA. A. phagocytophilum DNA levels were determined by msp4 real-time PCR normalizing against tick rpS4. Results are shown as average + S.D. normalized Ct-values and compared between treated and control groups by Student's t-test with unequal variance (P < 0.05; N = 5 biological replicates).

