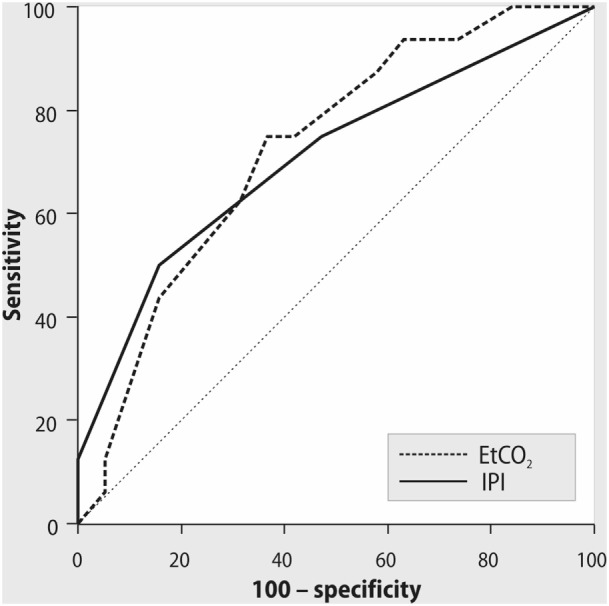
Figure 1.

ROC curves for Integrated Pulmonary Index (IPI), end-tidal CO2, and cardiac index < 2.5 L/min/m2 during mechanical ventilation. AUC = 0.72, p = 0.02; cutoff point of IPI ≤ 8, with sensitivity 84%, specificity 53%, positive predictive value 64%, negative predictive value 75%. AUC = 0.73, p = 0.02; cutoff point of PetCO2 ≤ 30 mmHg, with sensitivity 78%, specificity 68%, positive predictive value 70%, negative predictive value 76%.
