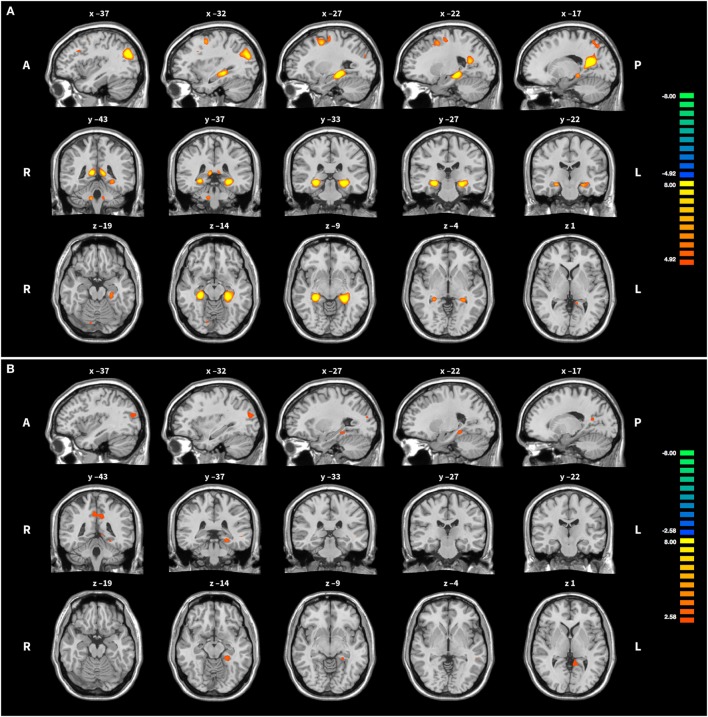
Figure 3.
Activation during upregulation. (A) Group HC: the middle column shows the peak of activation in the left parahippocampal gyrus, the target region of the training. Some further activation in frontal, parietal and cerebellar areas is visible as well. (B) Group PA: for easier comparison slices shown are the same as for group HC. Note the more liberal activation threshold in group PA. For both groups activation was averaged across all training runs and superimposed onto the Colin 27 average brain. Copyright (c) 1993–2009 Louis Collins, McConnell Brain Imaging Centre, Montreal Neurological Institute, McGill University.

