
Figure 2.
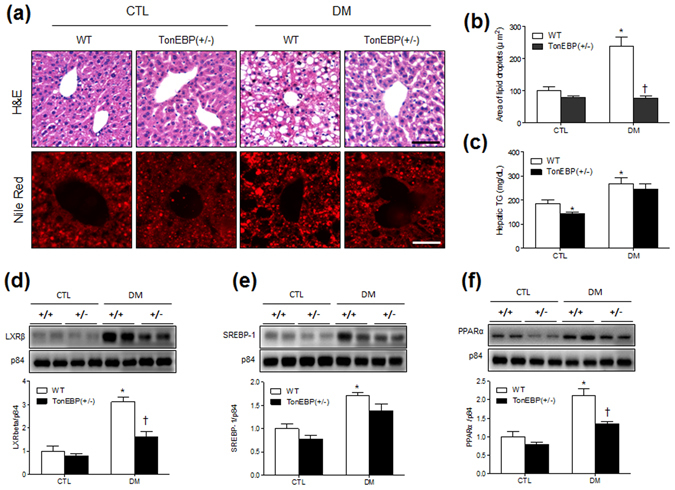
Effects of TonEBP haploinsufficiency on hepatic steatosis in HFD/STZ-treated mice. (a) Representative micrographs of H&E and Nile red staining; scale bar = 50 μm. (b) Percentages of Nile red-positive areas. (c) Concentrations of hepatic TG (n = 7–8 mice per group). Western blotting and quantification of nuclear LXRβ (d), SREBP-1 (e), and PPARα (f) in the livers. The mean values were obtained from three separate experiments (n = 6 mice per group). Cropped blots are displayed here and full-length blots are included in the Supplementary Information. Data are presented as the mean ± SEM. *P < 0.05 vs. control (CTL) normal diet-fed mice; † P < 0.05 vs. DM WT mice.