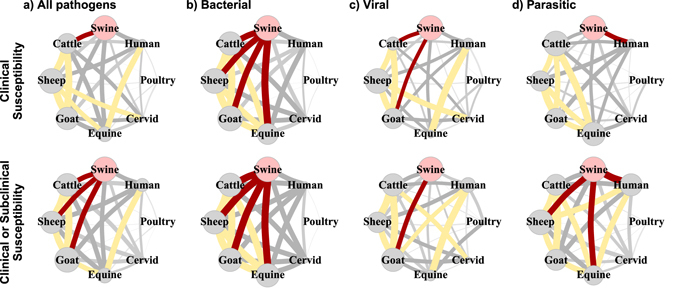
Figure 1.

Transmission potential networks used in this study created by connecting two host species if they were susceptible to the same pathogen causing clinical or subclinical disease in swine. Top row are pathogens causing clinical disease in non-swine hosts and the bottom row are all pathogens affecting non-swine hosts. Edge weight between two species is the similarity in the parasites infecting a pair of individuals calculated with the Jaccard index. Red edges denote Jaccard index in the upper 75th quartile, while light gray are edges in the lower 25th quartile. Node size indicates the relative centrality of the species group in the transmission network, calculated using the eigenvalue centrality – more central nodes are larger.
