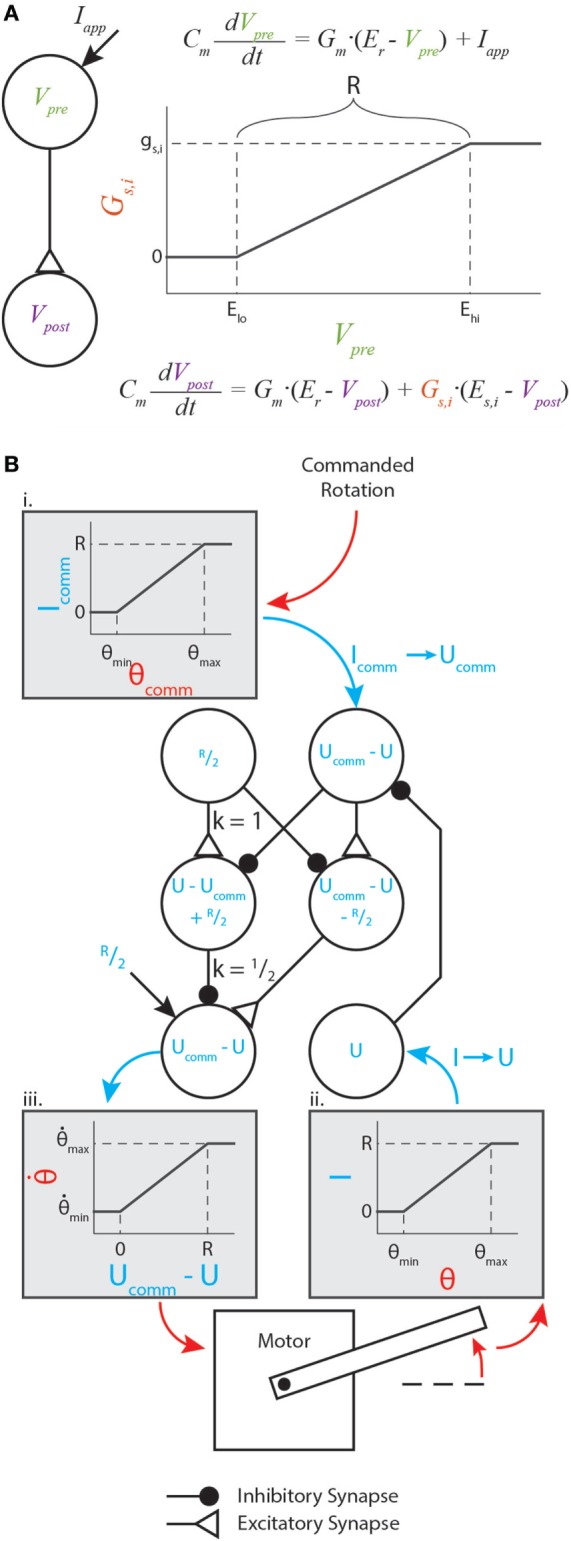
Figure 1.

Graphical representation of synaptic dynamics and mapping between mechanical and neural values. (A) Graphical representation of how synapses couple neural dynamics. Note that R is marked on the plot. (B) Enhanced version of the motor control network from Szczecinski et al. (2017b), showing how R relates mechanical and neural values. Mechanical values are drawn in red, and neural values are drawn in blue. Gray shaded boxes map from mechanical to neural values (i. and ii.), or from neural to mechanical values (iii.).
