
Figure 1.
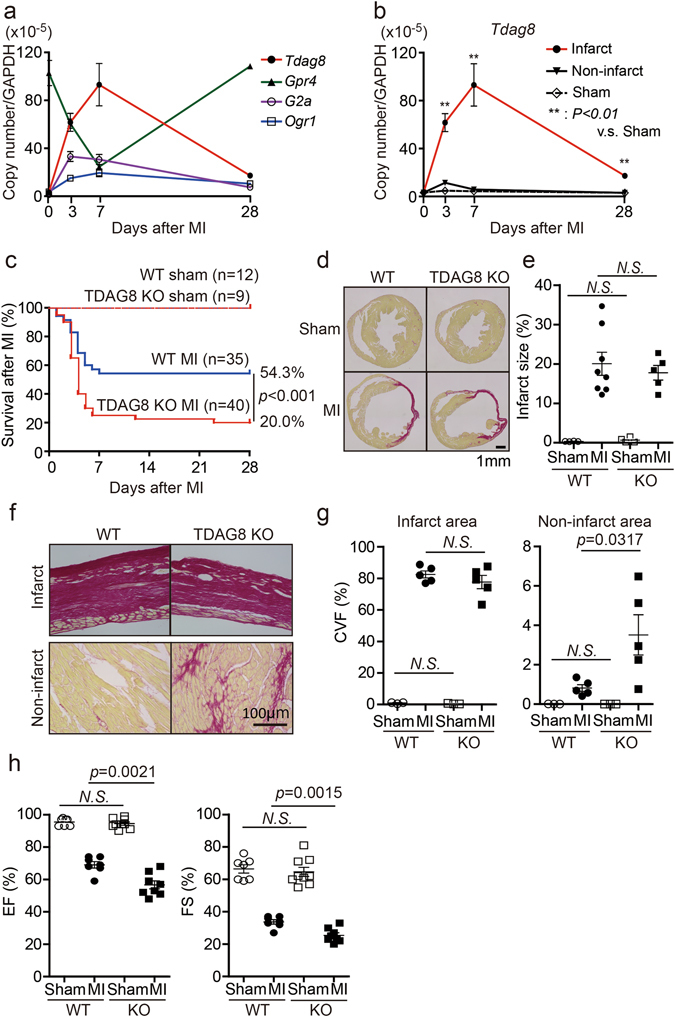
TDAG8 KO mice show high mortality in the early stages after MI. (a) Quantitative analysis of the expression of proton-sensing GPCR mRNAs in intact (n = 3) and infarcted WT hearts (n = 3–7). (b) Quantitative analysis of Tdag8 mRNA levels in infarcted and non-infarcted areas of WT hearts after MI (sham n = 3; MI n = 3–7). Comparisons of group data were assessed with unpaired Student’s t-tests. Data are shown as the mean ± SEM. (c) Kaplan-Meier survival curve analysis in WT mice (sham n = 12, MI n = 35) and TDAG8 KO mice (sham n = 9, MI n = 40) after MI or a sham operation. The difference between WT-MI mice and TDAG8-KO mice was evaluated using the log-rank test. (d) Picrosirius Red staining of cardiac sections in MI- or sham-operated WT mice and TDAG8 KO mice after 28 days. (e) The infarct size was quantitatively estimated. (f) Representative heart sections of infarct areas and non-infarct areas 28 days after MI or sham procedures in WT mice (sham n = 3, MI n = 5) and TDAG8 KO mice (sham n = 3, MI n = 5) stained with Picrosirius Red. Positive staining indicates fibrosis. (g) The fibrotic area was quantified. (h) Echocardiography of WT mice (sham n = 7, MI n = 7) and TDAG8 KO mice (sham n = 9, MI n = 8) 28 days after MI or sham operation. Ejection fraction (EF) and fractional shortening (FS) results are shown. Comparisons were assessed using unpaired Student’s t-tests. Error bars represent the mean ± SEM (N.S., not significant).