
Figure 1.
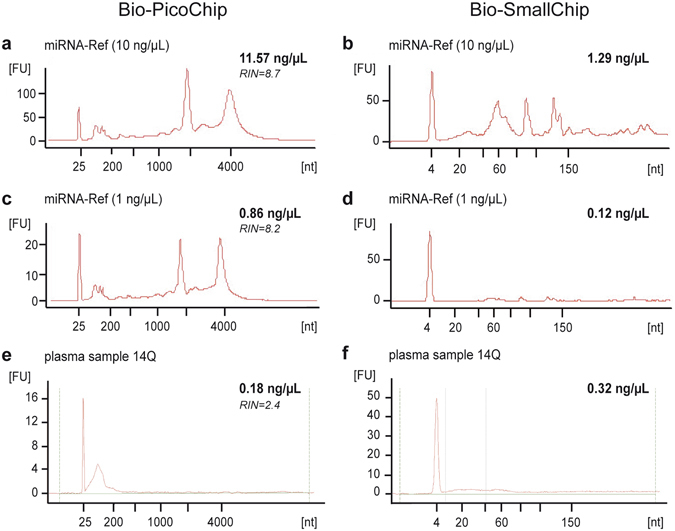
Electropherograms obtained with the Bioanalyzer 2100 in miRNA-Ref and plasma samples. Examples of the profiles obtained from a miRNA-Ref sample at 10 ng/μL (a, Bio-PicoChip; (b), Bio-SmallChip), a miRNA-Ref sample at 1 ng/μL (c, Bio-PicoChip; (d), Bio-SmallChip), and a plasma sample (e, Bio-PicoChip; (f), Bio-SmallChip). The 10 ng/µL miRNA-Ref sample (a) was diluted to fit the detection range of the Bio-PicoChip (0.05–5 ng/µL) and the final concentration was calculated by applying the dilution factor to the value obtained by the Bioanalyzer. In the miRNA-Ref samples (a–d), the overall profile is consistent with the presence of ribosomic RNA enriched with small RNAs, whereas in plasma samples (e,f) only small RNAs, but no long RNAs, are present. All electropherograms include the corresponding quantification (in bold) and the RNA integrity number (RIN) number (in italics) obtained with the Bio-PicoChip (a,c,e) or just the quantification (in bold) with the Bio-SmallChip (b,d,f).