
Figure 3.
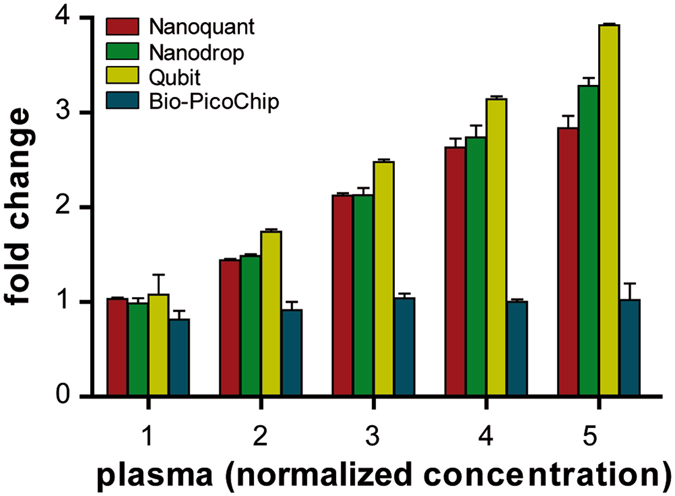
Quantification of plasma samples at different normalized concentrations assessed by Nanoquant, Nanodrop, Qubit and Bio-PicoChip. Evaluation of the performance of the four quantification techniques in a series of five increasing concentrations prepared from the pooled plasma. Data on the X axis are normalized to the lowest concentration (data in Supplementary Table S3). Bio-PicoChip results showed high variability and did not increase proportionally with increasing concentrations.