
Figure 4.
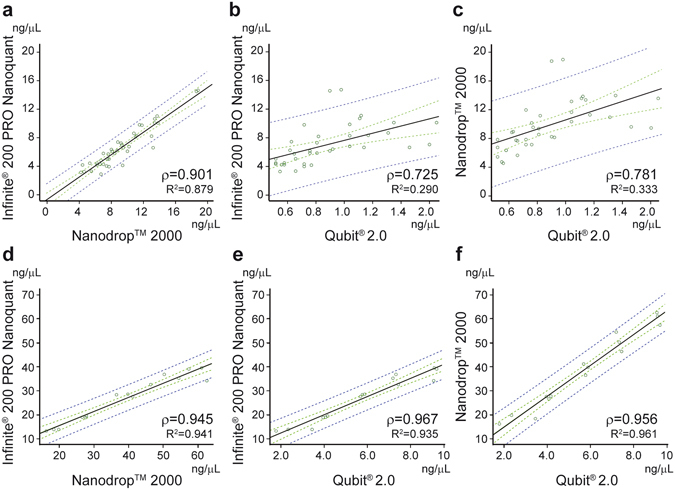
Correlations between Nanoquant, Nanodrop and Qubit. Correlations between techniques using original and diluted plasma samples (a–c). Correlations between techniques using concentrated plasma samples ≥2 ng/µL (d–f). Regression lines (black) with their 95% confidence interval (dashed green) and 95% prediction interval (dashed blue) were generated from the correlation of n = 41 (a–c) and n = 15 (d–f) quantification values. Correlations were assessed with Spearman rank correlation coefficient (ρ) and linear regression R2. Concentrations are expressed in ng/µL.