
Figure 5.
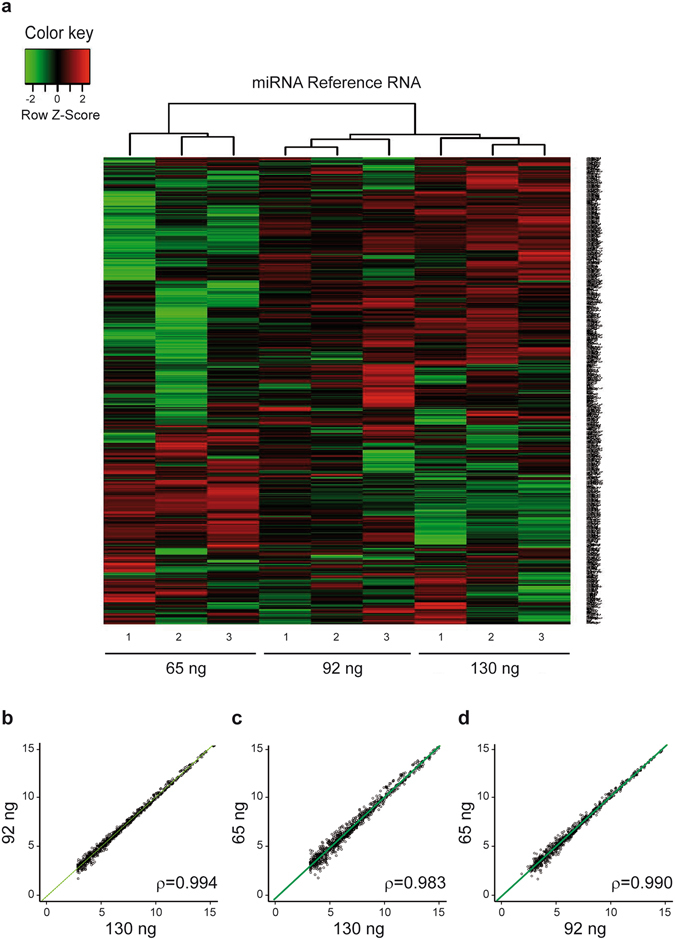
miRNA Reference RNA hybridization microarrays. (a) Heat maps obtained from three 130/, 92/and 65/miRNA-Ref hybridization microarrays. Only miRNA with significant expression (>3) in the 130 ng sample and observed in all three arrays are represented. (b) Correlation between the miRNA profiles of the mean of the triplicates for the three starting amounts. The regression line is represented as a solid green line. Axis units are expressed in log2 intensities.