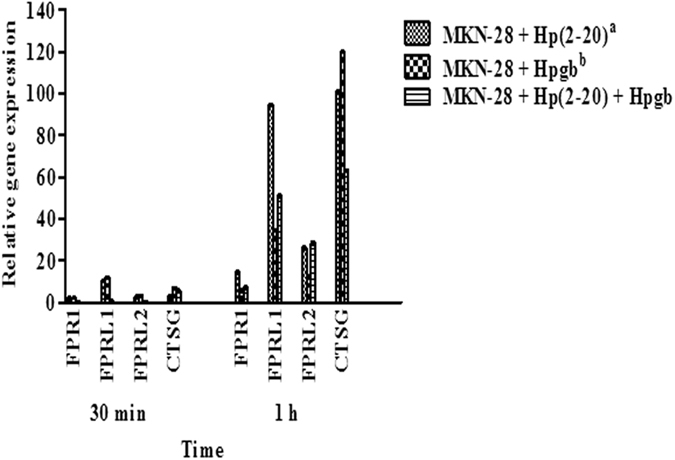
Figure 2.

MKN-28 mRNAs levels of FPR1, FPRL1, FPRL2 and CTSG. Results are representative of three independent experiments. Each value is the mean ± SD of three replicas. Expression values were normalized against the human glyceraldehydes-3-phosphate dehydrogenase (GAPDH) gene. Stability assay, carried out using the BestKeeper tool, indicated that GAPDH was more stable then ACT-β at 30 (1.03 vs 2.89) and 60 min (1.89 vs 3.29). Statistical analysis was carried out with the GraphPad Prism version 5.03 (GraphPad, La Jolla, CA, USA). Differences in expression levels between 30 min and 1 h are all significantly different (P < 0.001); aHp(2-20) concentration was 2 × 10⁻⁵ M; bHpgb = H. pylori growth broth (140 µl/well).
