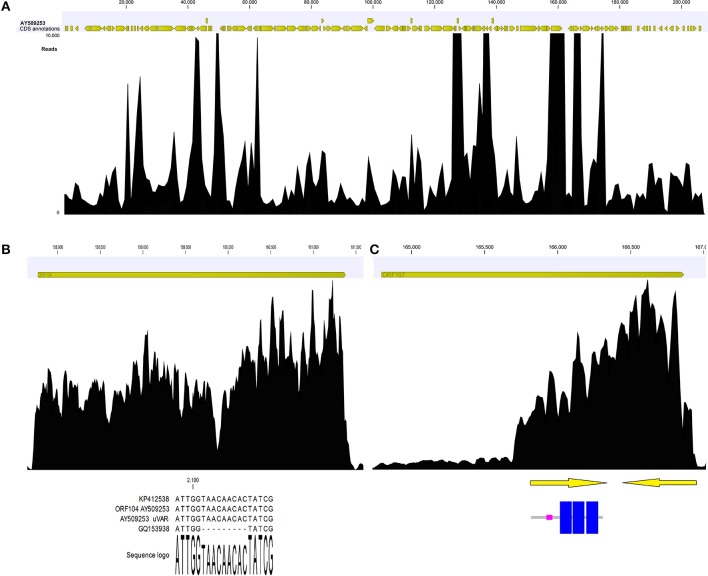
Figure 4.
Coverage graph of Malacoherpesviridae reads (A). Coverage graph of the whole OsHV-1 genome, as obtained by mapping 4.9 M viral reads with length and similarity mapping parameters set to 0.9. Yellow arrowheads indicate annotated ORFs along the virus genome. Maximum coverage was set to 10,000x. (B) Details of the ORF104 coverage graph, with the alignment including the 9-nt deletion causing coverage drop-off. (C) Details of ORF107 coverage graph, with two nested ORFs (arrows) that could explain the local coverage bias. One ORF encoded three transmembrane regions (highlighted in blue).

