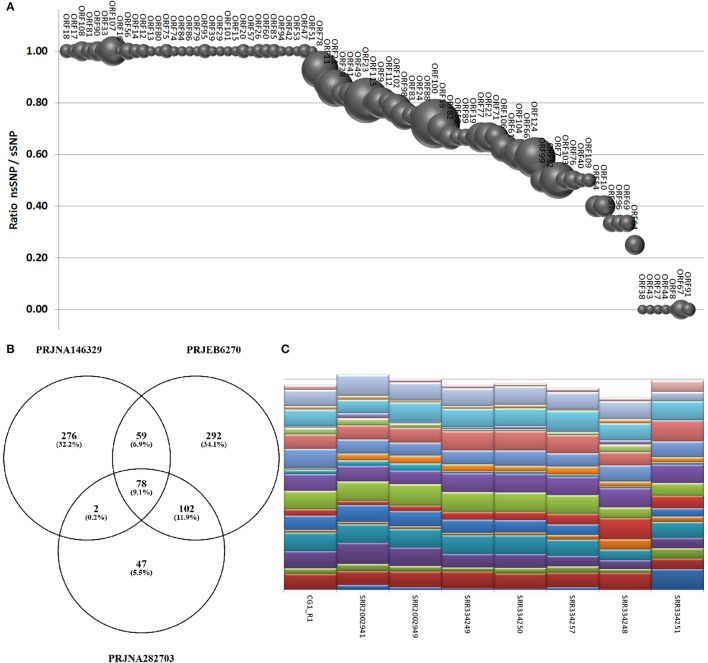
Figure 6.
(A) SNPs occurrence in OsHV-1 ORFs. The graph depicts the ratio of nsSNP vs. total SNP for the ORFs presenting at least one variation. Globe size is proportional to the number of SNP for each ORF. (B) Common and exclusive SNPs indicated in the Venn diagram resulted from the comparison of oyster RNA-seq samples grouped by origin. (C) “Genotyping” graph based on 20 polymorphic common OsHV-1 SNPs in the eight samples richest in viral reads (indicated by IDs).

