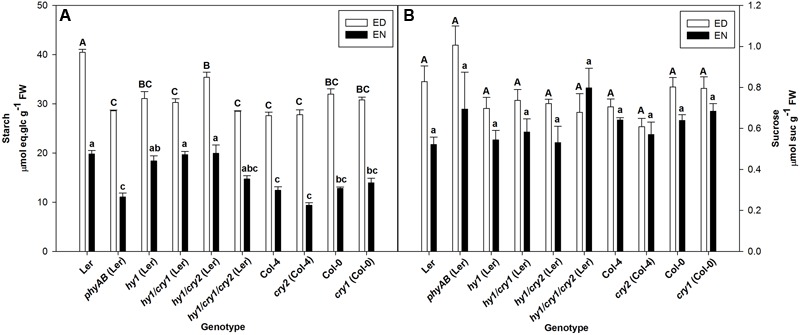
FIGURE 1.

(A,B) Starch and sucrose contents at ED and EN in photoreceptor mutants and their respective WTs. Plants were grown under FL2 with PPFD of 115 ± 5 μmol m-2 s-1. Results are mean ± SE of measurements made on five biological replicates. Significant differences (p < 0.05) are indicated by different letters, uppercase for ED, and lowercase for EN.
