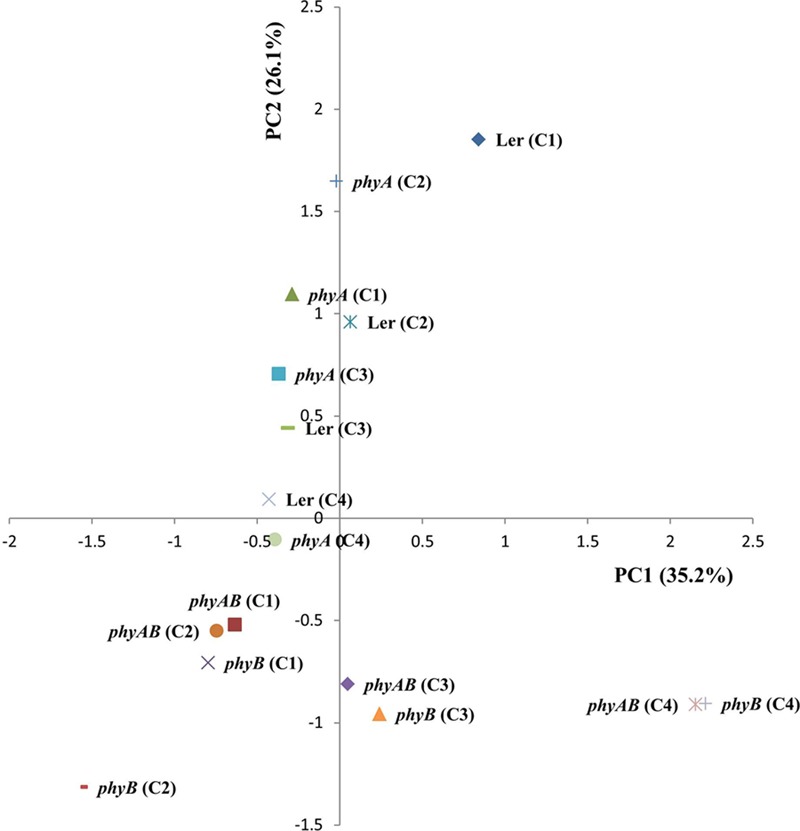
FIGURE 4.

Leaf metabolome analysis of WT and the phyA, phyB, and phyAB mutants using PCA. Plants were grown in four different white light conditions and sampled at ED.

Leaf metabolome analysis of WT and the phyA, phyB, and phyAB mutants using PCA. Plants were grown in four different white light conditions and sampled at ED.