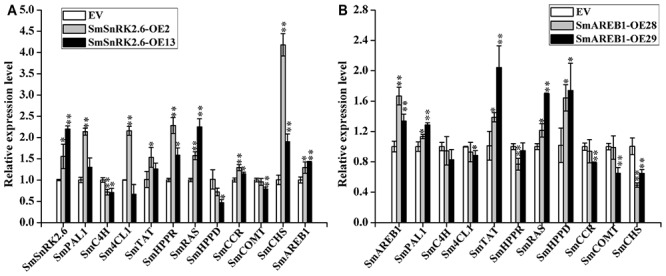
FIGURE 8.

Quantitative real-time PCR analysis of related genes in EV, SmSnRK2.6-overexpressing transgenic lines (SmSnRK2.6-OE2 and SmSnRK2.6-OE13) (A), and SmAREB1-overexpressing transgenic lines (SmAREB1-OE28 and SmAREB1-OE29) (B). PAL, phenylalanine ammonia lyase; C4H, cinnamic acid 4-hydroxylase; 4CL, 4-coumaric acid CoA-ligase 1; TAT, tyrosine aminotransferase; HPPR, 4-hydroxyphenylpyruvate reductase; RAS, rosmarinic acid synthase; HPPD, 4-hydroxyphenylpyruvate dioxygenase; CHS, chalcone synthase; CCR, cinnamoyl-CoA reductase; COMT, caffeic acid O-methyltransferase. Data represent means ± SD of three replicates. Asterisks denote significant differences at ∗P < 0.05, ∗∗P < 0.01, compared to the vector control and obtained via Student’s t-test.
