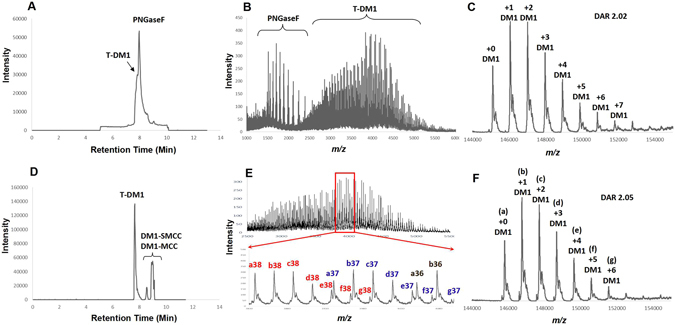
Figure 3.

Comparison of LC-MS data of deglycosylated ADC 4 by PNGase-F and Endo-S. Total Ion Chromatograms (TIC) of T-DM1 (4) after deglycosylation with PNGase-F (Panel A) and Endo-S (Panel D); multi-charged m/z profiles of 4 after deglycosylation with PNGase-F (Panel B) and Endo-S (Panel E, upper: wide mass range 2500–5500; bottom: zoom-in mass range 3800–4100); deconvolution data and DAR calculation of 4 after deglycosylation with PNGase-F (Panel C) and Endo-S (Panel F).
