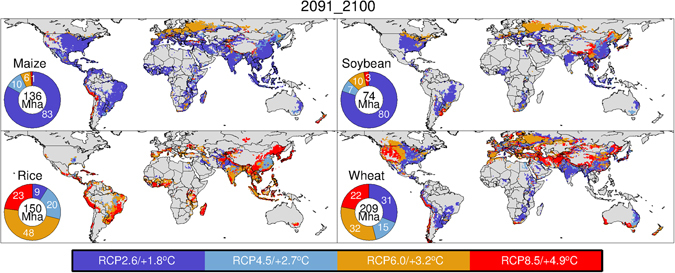
Figure 3.

The temperature increase and corresponding mitigation level (RCP) at which the anticipated yield growth for 2100 (the average for the period 2091–2100) was found to be the highest for the four RCPs. Any warming above this level leads to yield stagnation. The pie diagrams denote percentages of harvested area under the aforementioned warming levels. All data shown in the pie diagrams are normalized to the global harvested area for 2000. The maps presented here were created from Generic Mapping Tools (GMT)49 version 4.5.12 (https://www.soest.hawaii.edu/gmt/) using data described in the main text.
