
Figure 4.
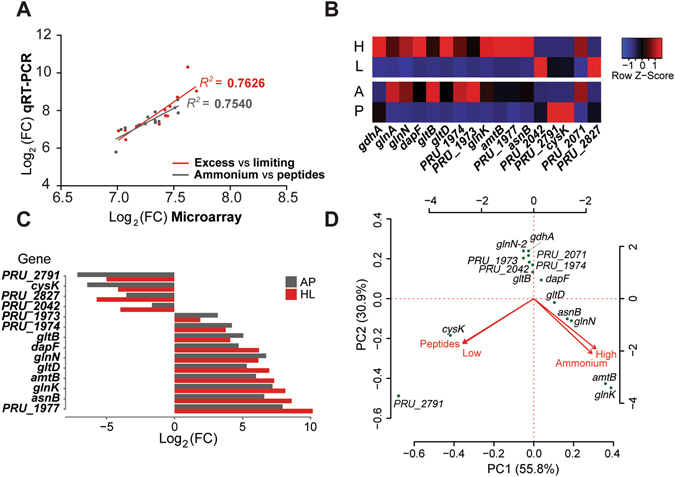
(A) Log transformation of the fold change in transcript abundances obtained through microarray and qRT-PCR indicates consistency in the results obtained through both techniques (B) Heat map displaying normalized changes in transcript abundances for a subset of genes implicated in nitrogen metabolism. Highest obtained values under non-limiting nitrogen conditions corresponded to genes related to ammonium transport (amtB, ammonium transporter gene; PRU_1977, hypothetical transporter), ammonium assimilation and its regulation (PRU_2048, NAD-dependent glutamate dehydrogenase; PRU_2071, gdhA, NADP-dependent glutamate dehydrogenase; glnA, glutamine synthetase type I; glnN-1 glutamate synthetase type III-1; glnN-2 glutamate synthetase type III-2; gltB, glutamate synthase, large subunit; gltD, glutamate synthase, small subunit; glnK, nitrogen regulatory protein PII), amino acid and protein biosynthesis (dapF, diaminopimelate epimerase; asnB, asparagine synthase; PRU_1974, aminotransferase, homolog; PRU_1973, glutamine amidotransferase). Highest values under growth on peptides corresponded to genes involved in protein biosynthesis (PRU_2971, O-acetylhomoserine aminocarboxypropyltransferase; cysK, cysteine synthase; PRU_2042, diaminopimelate dehydrogenase), or had unclear roles in nitrogen metabolism (PRU_2827, outer membrane receptor RagA) (H, growth on excess ammonium; L, growth on limiting ammonium concentrations; A, growth on ammonium; P, growth on peptides). (C) Comparison of log transformed fold changes in transcript abundances obtained by qRT-PCR in the assayed growth conditions (AP, Ammonium vs Peptides, HL, excess (H) vs growth-limiting (L) ammonium concentrations). Gene symbols and observed trends as in (B). (D) Principal component analysis integrating fold change in transcript abundances obtained through microarray and qRT-PCR on P. ruminicola 23 grown in different nitrogen sources (ammonium or peptides) or ammonium concentrations (excess [high] or growth-limiting [low]). Arrows point in the direction of the maximum correlation. Gene symbols as in (B) and (D).