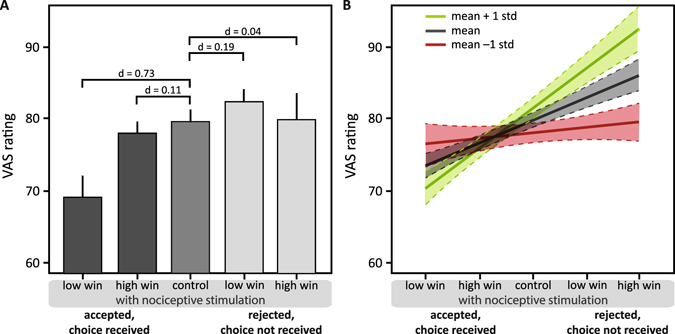
Figure 3.

Perception of the nociceptive stimuli in win trials. (A) Means and 95% confidence intervals of VAS ratings in the five conditions with nociceptive stimulation: accepted and received with low win, accepted and received with high win, control condition, rejected and not received with low win, rejected and not received with high win. Post-hoc comparisons: effect size indicated by Cohen’s d. (B) Effects of subjective utility as a moderator are depicted by regression lines with 95% confidence intervals of estimated VAS ratings at below average (mean −1 standard deviation; green), average (mean; grey), and above average (mean +1 standard deviation; red) values of the utility index. The higher the values of the utility index, the higher the participant’s tendency to accept a win and a nociceptive stimulus and the stronger the perceptual modulation.
