
Figure 5.
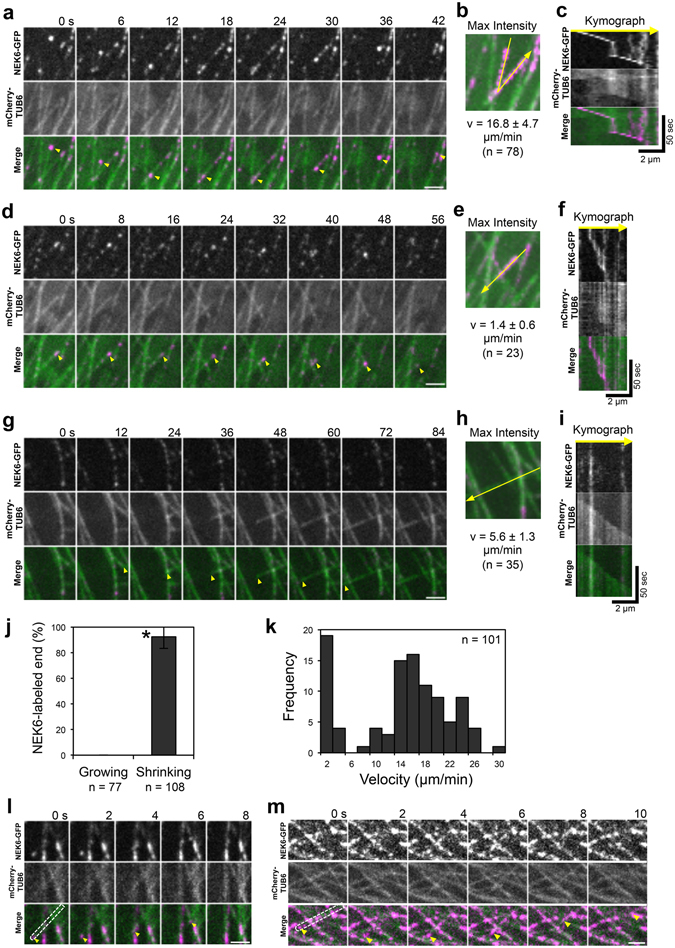
NEK6 Localizes to the shrinking microtubule ends. (a) A time-lapse montage showing that NEK6-GFP localizes to shrinking microtubule plus end. Arrowheads indicate the shrinking plus end of a microtubule. The scale bar represents 2 µm. (b) A maximum intensity projection of (a). The yellow line shows the location of the kymograph line. (c) Kymograph of the line in (b). (d) A time-lapse montage showing that NEK6-GFP localizes to the shrinking microtubule minus end. Arrowheads indicate the shrinking minus end of a microtubule. The scale bar represents 2 µm. (e) A maximum intensity projection of (d). The yellow line shows the location of the kymograph line. (f) Kymograph of the line in (e). (g) A time-lapse montage showing that NEK6-GFP does not localize to the growing plus end. Arrowheads indicate the growing plus end of a microtubule. The scale bar represents 2 µm. (h) A maximum intensity projection of (G). The yellow line shows the location of the kymograph line. (i) Kymograph of the line in (H). (j) The percentage of growing or shrinking ends of microtubules labeled with NEK6-GFP. Data are displayed as averages ± SD. The asterisk indicates significant difference from the value in the growing ends (t-test, P < 0.001). (k) Histogram of shrinking rates for NEK6-GFP-labelled microtubules. (l, m) A time-lapse montage showing that NEK6-GFP localizes to the shrinking end of a detached and distorted cortical microtubule. Arrowheads indicate the NEK6-GFP-localized shrinking end. The areas enclosed by broken lines indicate the detached microtubules. The scale bar represents 2 µm. RFP signals are shown in green and GFP signals are shown in magenta in (a–i,l,m).