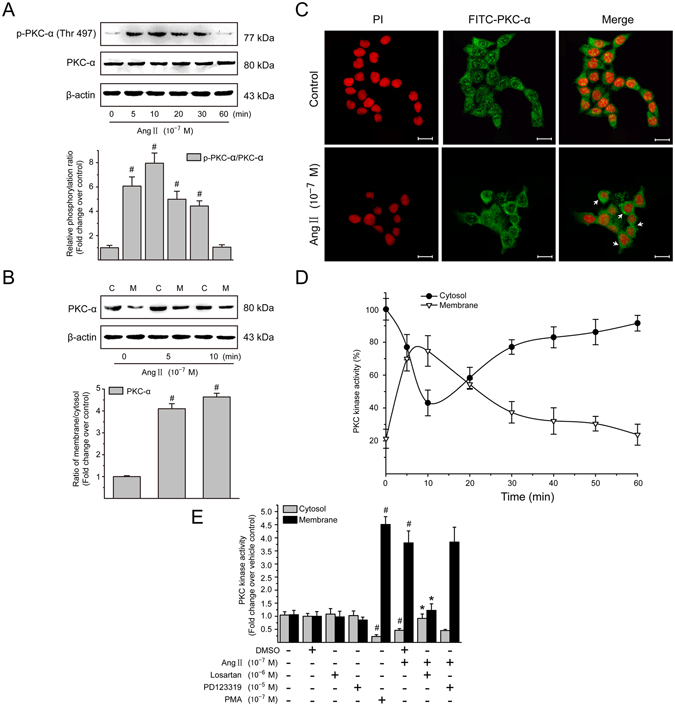
Figure 3.

Ang II induces PKC-α activation via AT1 in LX-2 cells. (A) Serum-starved LX-2 cells were exposed to Ang II (10−7 M) for 0, 5, 10, 20, 30 and 60 min. Whole cell protein extracts were then subjected to immunoblotting analysis. Similar results were observed in 3 independent experiments, and representative immunoblot bands probed with antibodies against phospho-specific and total PKC-α are shown. Total protein level of PKC-α served as an internal control. (B) Serum-starved LX-2 cells were stimulated with Ang II (10−7 M) for 0, 5 and 10 min. Cytoplamic (C) and membraneous (M) fractions were analyzed by immunoblotting with an antibody against PKC-α. Similar results were observed in 3 independent experiments, and a representative immunoblot band of PKC-α is shown. The membrane-to-cytosol ratio was used to calculate fold translocation (or activation) over that of unstimulated cells. (C) Serum-starved LX-2 cells were treated with Ang II (10−7 M) for 10 min, and incubated with primary antibody against PKC-α, followed by incubation with FITC-conjugated IgG (green). The nuclei were revealed with PI (red). Cytosol to cell membrane translocation of PKC-α was visualized and photographed by a confocal laser scanning microscope. Scale bar, 20 μm. (D) Serum-starved LX-2 cells were stimulated with Ang II (10−7 M) for 0–60 min. Graphical presentation showing time course of the relative kinase activity of PKC in the cytosolic and membrane fractions. The PKC kinase activity was expressed as the percentage of the cytosolic value in unstimulated control (100%). (E) Serum-starved LX-2 cells were preincubated with losartan (10−6 M) or PD123319 (10−5 M) for 1 h and then stimulated with Ang II (10−7 M) for 10 min. PMA (10−7 M), a PKC activator, was used as a positive control. PKC enzyme activities in nuclear and membranous protein lysates were quantified using a colorimetric PKC Kinase Activity Assay Kit. The PKC activity in vehicle control cells was set as 1. Data are presented as mean ± SD of 3 independent experiments. # P < 0.05 versus unstimulated or vehicle-treated control cells; * P < 0.05 versus Ang II-treated cells.
