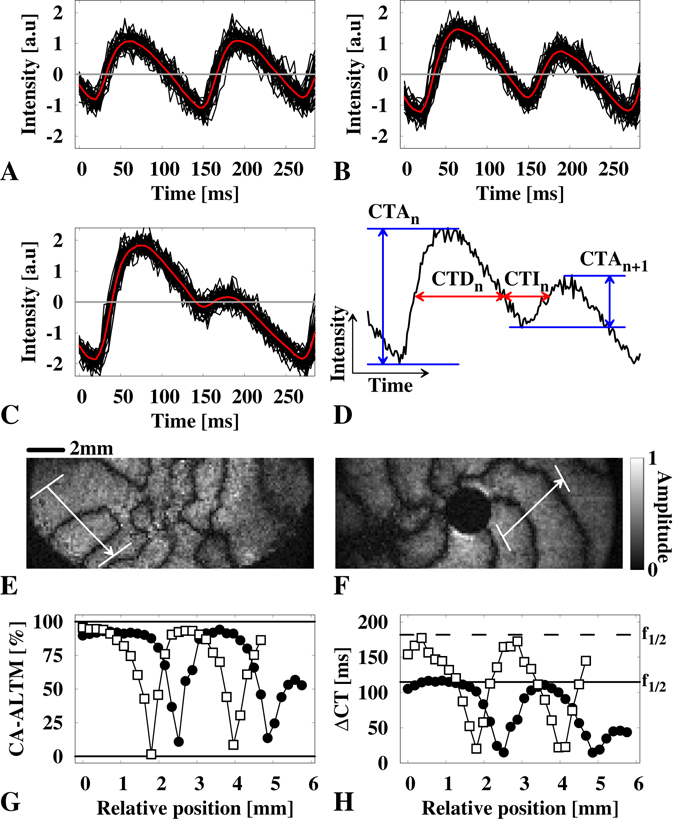
Figure 2.

Analysis of spatially concordant alternans. (A to C) show three typical calcium signaling examples that are obtained using the signal oversampling technique (black lines). The average is shown as a red line that is used to quantify CA-ALTM and ΔCT (see Eqs (1) and (2)). A shows an example observed at a nodal line. (B and C) show examples of low (CA-ALTM ~ 100%) and strong (CA-ALTM ~ 50%) alternans, respectively. (D) shows an illustration of the cytosolic transient amplitude (CTA) and cytosolic transient duration/interval (CTD/CTI) in a typical single pixel recorded cytosolic calcium signal of high-frequency paced waves. CTD and CTI are determined by considering the intensity threshold at 50%. (E and F) show a free and an obstacle-anchored discordant alternating wave obtained by multidimensional Fourier analysis, respectively. The nodal lines are analyzed in line segments perpendicular to the nodal line orientation along a line segment of approximately 5 mm (see arrows in E) and (F). (G and H) show the CA-ALTM and ΔCT calculated along the line segment by Eq. (1) and by Eq. (2), respectively. The black circles and white squares correspond to the examples shown in E and F, respectively.
