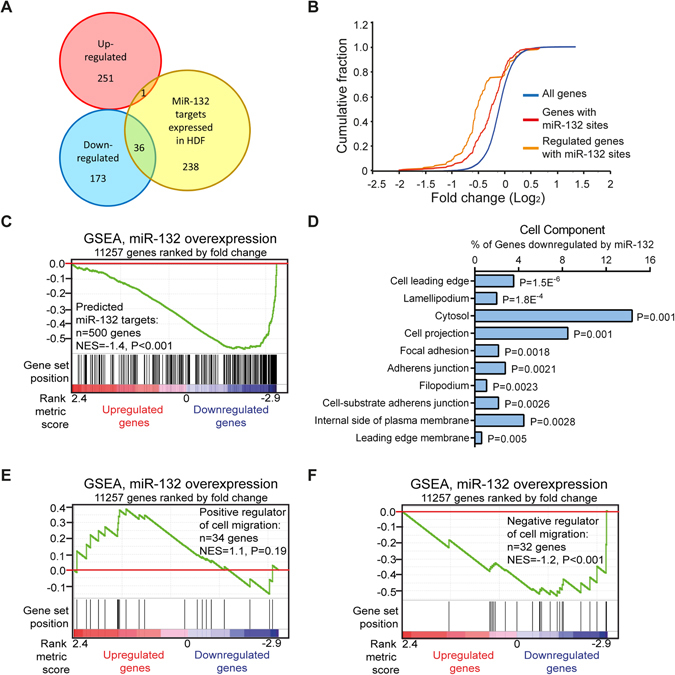
Figure 2.

Transcriptome analysis of fibroblasts overexpressing miR-132. (A) Venn diagram depicting the number of genes significantly up- (red) or down-regulated (blue) by miR-132 (fold change ≥ 1.5, P <0.05) and TargetScan predicted miR-132 targets that expressed in HDFs (yellow). (B) Cumulative distribution plots of log2-transformed fold-changes for genes predicted to contain miR-132 binding sites (red), genes with miR-132 sites and regulated by miR-132 (orange) and all the genes detected by microarray (blue). (C) Genes in microarray data were ranked by fold change (miR-132 mimic / Ctrl mimic). GSEA evaluated enrichment within the profile data for the predicted target genes of miR-132. Vertical bars along the χ axis denote the positions of miR-132 target genes within the ranked list. NES, normalized enrichment score. (D) The top10 gene ontology cell component terms for the genes down-regulated by miR-132 in fibroblasts. P-values were determined by the Fisher’s exact test. GSEA evaluated enrichment within the microarray data for the genes reported to accelerate (E) or impair (F) cell migration.
