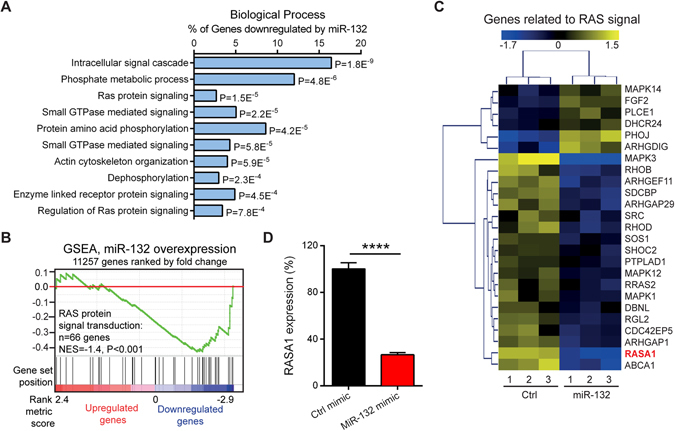
Figure 4.

MiR-132 regulates RAS signalling pathway. (A) The top10 gene ontology biological process terms for the genes down-regulated by miR-132 in fibroblasts. P-values were determined by the Fisher’s exact test. (B) GSEA evaluated enrichment for the genes related to the RAS signalling within the microarray data. (C) The genes related to the RAS signalling were regulated by miR-132 in fibroblasts. Heat map illustrates levels of significantly changed genes (fold change ≥ 1.2, P < 0.05). Colour intensity is scaled within each row so that the highest expression value corresponds to bright yellow and the lowest to bright blue. (D) RASA1 was detected by qRT-PCR in HDFs transfected with 20 nM miR-132 mimics or control oligos (n = 3). The data are presented as mean ± s.d. ****P < 0.0001 by Student’s t test.
