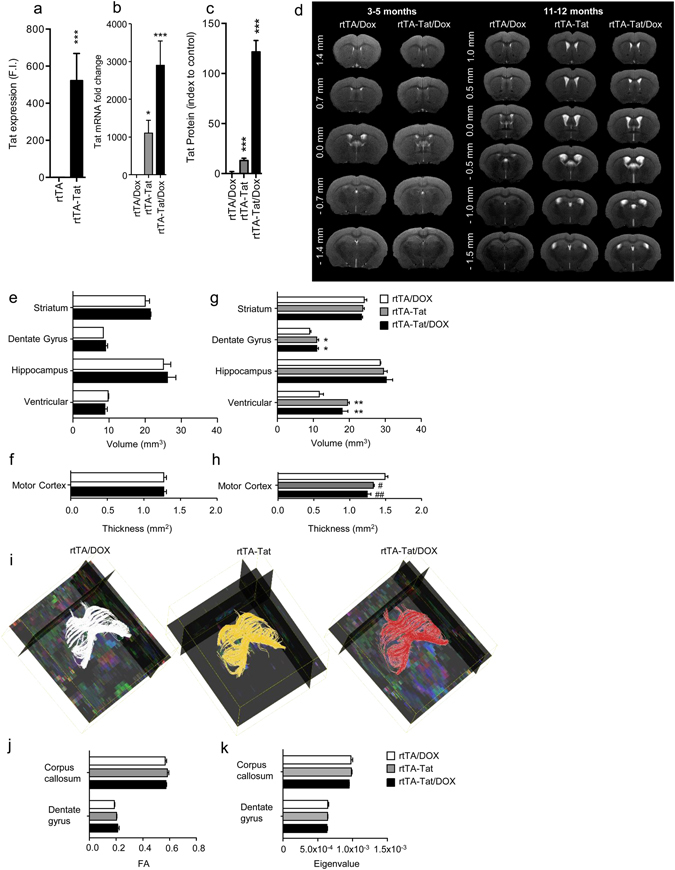
Figure 1.

Brain volume loss is observed in doxycycline naïve rtTA-Tat mice at 12 months of age. qRT-PCR analysis showing expression of tat mRNA in cortex of (a) 3-month old control rtTA mice, and doxycycline naïve rtTA-Tat mice, and (b) 11–12 month old doxycycline treated control rtTA mice, doxycycline naïve rtTA-Tat mice, and doxycycline treated rtTA-Tat mice. (c) Tat protein expression in cortex of 11–12 month old doxycycline treated control rtTA mice, doxycycline naïve rtTA-Tat mice, and doxycycline treated rtTA-Tat mice. (d) Representative T2 weighted images from 3–5 and 11–12 month old mice of the indicated genotype and treatment conditions showing enlargement of ventricles in 11–12 month old doxycycline naïve and doxycycline treated rtTA-Tat mice compare with doxycycline treated rtTA control mice. (e,f) Bar graphs show volumetric quantification of the ventricle, hippocampus, dentate gyrus, striatum, and motor cortex of 3–5 month animals and (g,h) of 11–12 month animals. (i) Representative fiber tracking maps of the corpus callosum calculated from the diffusion weighted MRI images. Quantification of the fractional anisotropy (j) and parallel eigenvalue (k) the diffusion weighted images in 11–12 month old animals. Data are mean ± SEM of n = 6–7 animals/group. ANOVA with Tukey post hoc comparisons, *p < 0.05 compared to control, ***p < 0.001 compared to rtTA control.
