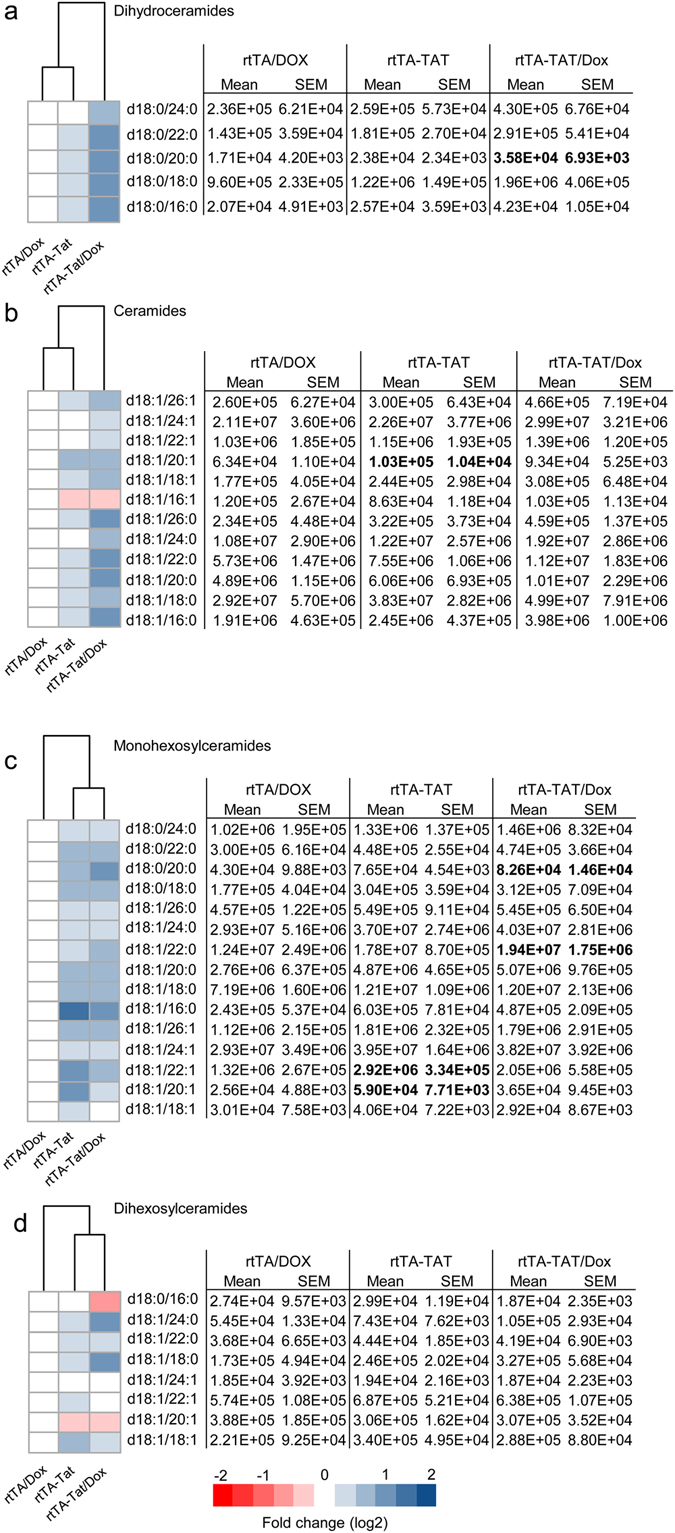
Figure 3.

Accumulation of ceramide in cortex of rtTA-Tat mice. Concentrations of (a) dihydroceramides, (b) ceramides, (c) monohexosylceramides, and (d) dihexosylceramides, were determined in cortex of mice with the indicated genotypes. Hierarchal clustering analysis is shown to the left of each class of lipid. Blue colors indicates increase and red colors indicates decrease compared to rtTA control mice. Data are expressed as mean ± SEM, n = 6–7 per group. Bold text in table indicates p < 0.05 compared to rtTA control group. ANOVA with Tukey post hoc comparisons.
