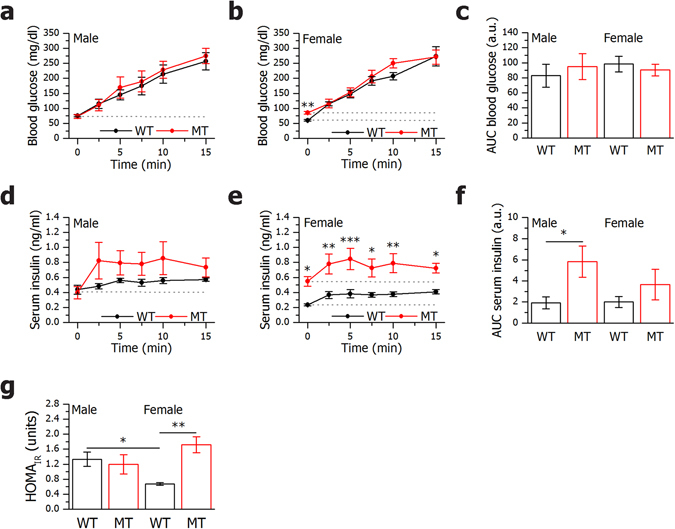
Figure 2.

In vivo glucose tolerance tests demonstrate increased insulin secretion in SNAP-25b-deficient mice. After 12 h starvation, male and female 11 week old WT and MT mice received an i.p. glucose injection (2 g/kg). Blood glucose and serum insulin in males (a,d) and females (b,e) were measured during 15 min after glucose injection. AUC for blood glucose (c) and serum insulin (f) were calculated using basal levels as baseline (baselines used for calculations are indicated with dotted lines). HOMAIR was calculated for all experimental groups (g). n = 5–6 animals per group. WT mice, black circles and bars; MT mice red circles and bars. Data are represented as mean ± SEM, *P < 0.05, **P < 0.01, ***P < 0.001.
