Figure 3.

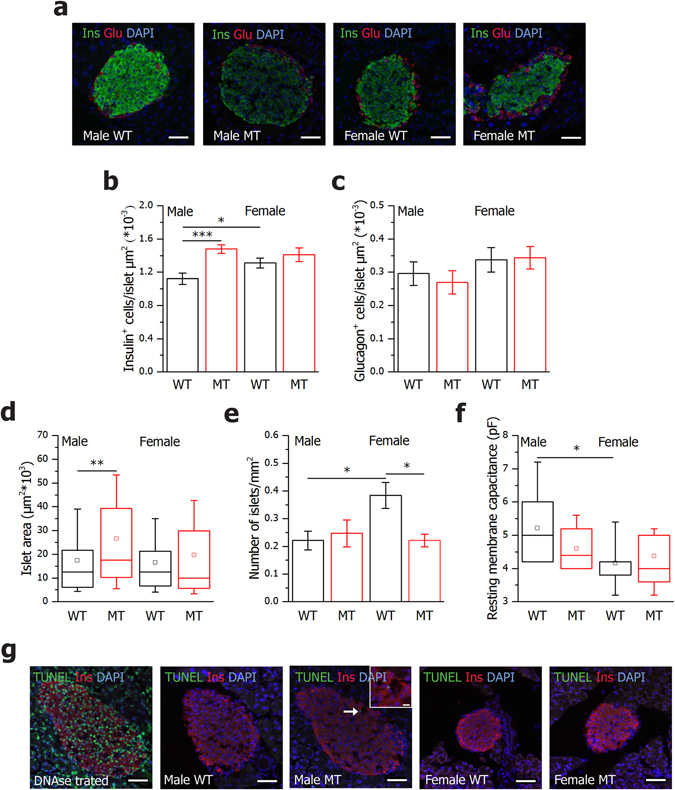
Male SNAP-25b-deficient islets are larger than WT littermates and have an increased number of β cells. Pancreatic sections from male and female 12 week old WT and MT mice were immunolabeled for insulin (green) and glucagon (red). Nuclei were detected with DAPI (blue) (a). Number of insulin-positive cells (b) and glucagon-positive cells (c) per islet was calculated in 3 islets from each mouse (n = 4 for each group). The islet areas are represented as box plots for male and female mice (d). The number of islets per pancreatic section area was calculated in male and female mice (e). Resting membrane capacitance of β cells (f), WT males, n = 2, 10 cells, MT males, n = 2, 11 cells, WT females, n = 4, 17 cells, MT females, n = 2, 11 cells. TUNEL staining of pancreatic sections from male and female 12 week old WT and MT mice (g). Nuclei were stained with DAPI (blue), β cells with anti-insulin antibody (red), and apopotic cells in green. A DNAse I treated section was added in the experiment as positive control (n = 3 for each experimental group). Only one β cell was found positive for TUNEL in a MT male islet (inset). The box plots (d,f) indicate the interval within 25th and 75th percentiles, lines within the boxes indicate the medians, and the small squares stand for the mean values. The whiskers denote the interval within 10th and 90th percentiles. Bar charts are represented as mean ± SEM (b,c,e). WT mice, black bars; MT mice red bars. Scale bar 50 µm (inset 10 µm). *P < 0.05, **P < 0.01, ***P < 0.001.
