Figure 4.

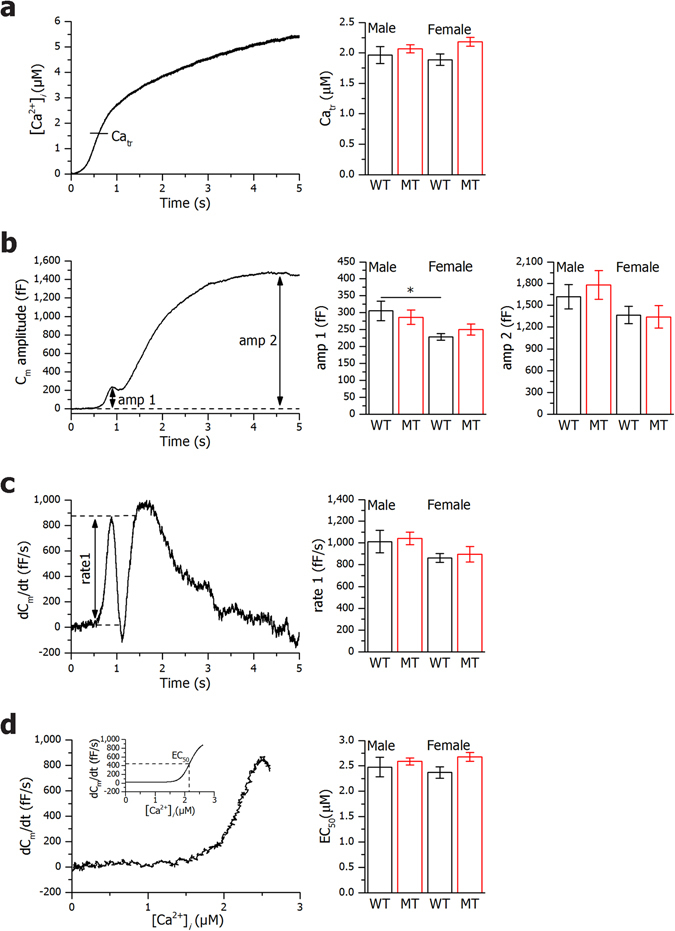
Slow photo-release of caged Ca2+. Slow photo-release of Ca2+ produced a ramp-like increase in [Ca2+]i as shown in a representative β cell (left panel). Panel on the right displays calcium concentration measurements at which membrane capacitance was triggered for all experimental groups (a). After reaching the threshold value of [Ca2+]i (Catr) a biphasic increase in membrane capacitance (C m) is observed, with the first phase reaching maximal amplitude within the first second after the initiation (amp1) and the second phase reaching maximal amplitude at amp2 (b). On the right panel amp1 and amp2 measurements for all experimental groups are shown (b). Time derivatives of C m amplitudes are presented in left panel (c), with maximal rate of the first phase (rate1). In the right panel, rate1 measurements for all experimental groups are shown (c). The rate of the C m change shown in panel d shows saturation kinetics when plotted versus [Ca2+]i with high cooperativity and half-effective [Ca2+]i (EC50) (d). The inset shows a Hill function fit through the Ca2+-dependence data (d). In the right panel, EC50 measurements for all experimental groups are shown (d). WT males, n = 2, 10 cells, MT males, n = 2, 11 cells, WT females, n = 4, 17 cells, MT females, n = 2, 11 cells. Bar charts are represented as mean ± SEM. WT mice, black bars; MT mice red bars. *P < 0.05.
